Key concepts and common tasks
Whether you’re just exploring the data on datacommons.org, using the programmatic APIs, or contributing data, it’s helpful to have a basic understanding of some of the key concepts in Data Commons. Use the following guidance:
- If you are only using Data Commons interactive tools, Google Sheets or CSV download, you should at least be familiar with entities and statistical variables. You may wish to just skip directly to those sections.
- If you plan to use the programmatic APIs, contribute data, or run your own Data Commons, you should read this entire page.
- Schema
- Knowledge Graph
- Type
- Entity
- Event
- Statistical variable
- Unique identifier: DCID
- Property
- Observation
- Provenance, Source, Dataset
Schema
To allow data from hundreds of organizations around the world, in a myriad of models and formats to be interoperable and queryable in a unified way, Data Commons needs to have a common way of understanding and representing this data. To do so, it applies a schema, or vocabulary to all its data, that is largely derived from earlier schemes developed for semantic understanding of web pages – most notably, the data models and schemas of Schema.org (which were in turn based on earlier schemes such as Microformats and Resource Description Framework (RDF)).
The Data Commons schema is in fact a superset of Schema.org schemas, with a particular emphasis on time series and statistical data. Every data set must have an associated schema, written in Meta Content Format (MCF) language, that maps the provider’s data to existing concepts in the Data Commons knowledge graph.
Knowledge Graph
Data Commons models the world as a directed labeled graph, consisting of a set of nodes and edges with labels, known as properties. This general framework allows Data Commons to represent information about a wide range of domains: from time series about demographics and employment, to hurricanes, to protein structures.
As a simple example, here are a set of nodes and edges that represent the following statements:
- California is a state
- Santa Clara county and Berkeley are contained in the state of California
- The latitude of Berkeley, CA is 37.8703
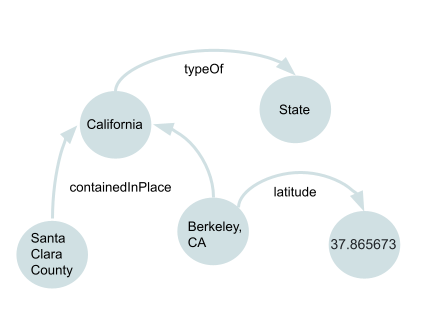
Each node consists of some kind of entity or value, and each edge describes some kind of property. More specifically, each node consists of the following objects:
- One or more types: an entity, event, statistical variable, or statistical observation
- A unique identifier, known as a DCID
- Various properties
- A provenance
As in other knowledge graphs, each pair of connected nodes is a triple consisting of a subject node, predicate (or “edge”) and object node. The Data Commons knowledge graph is made up of billions of triples. The triple is not generally exposed in Data Commons as a concept that you need to know.
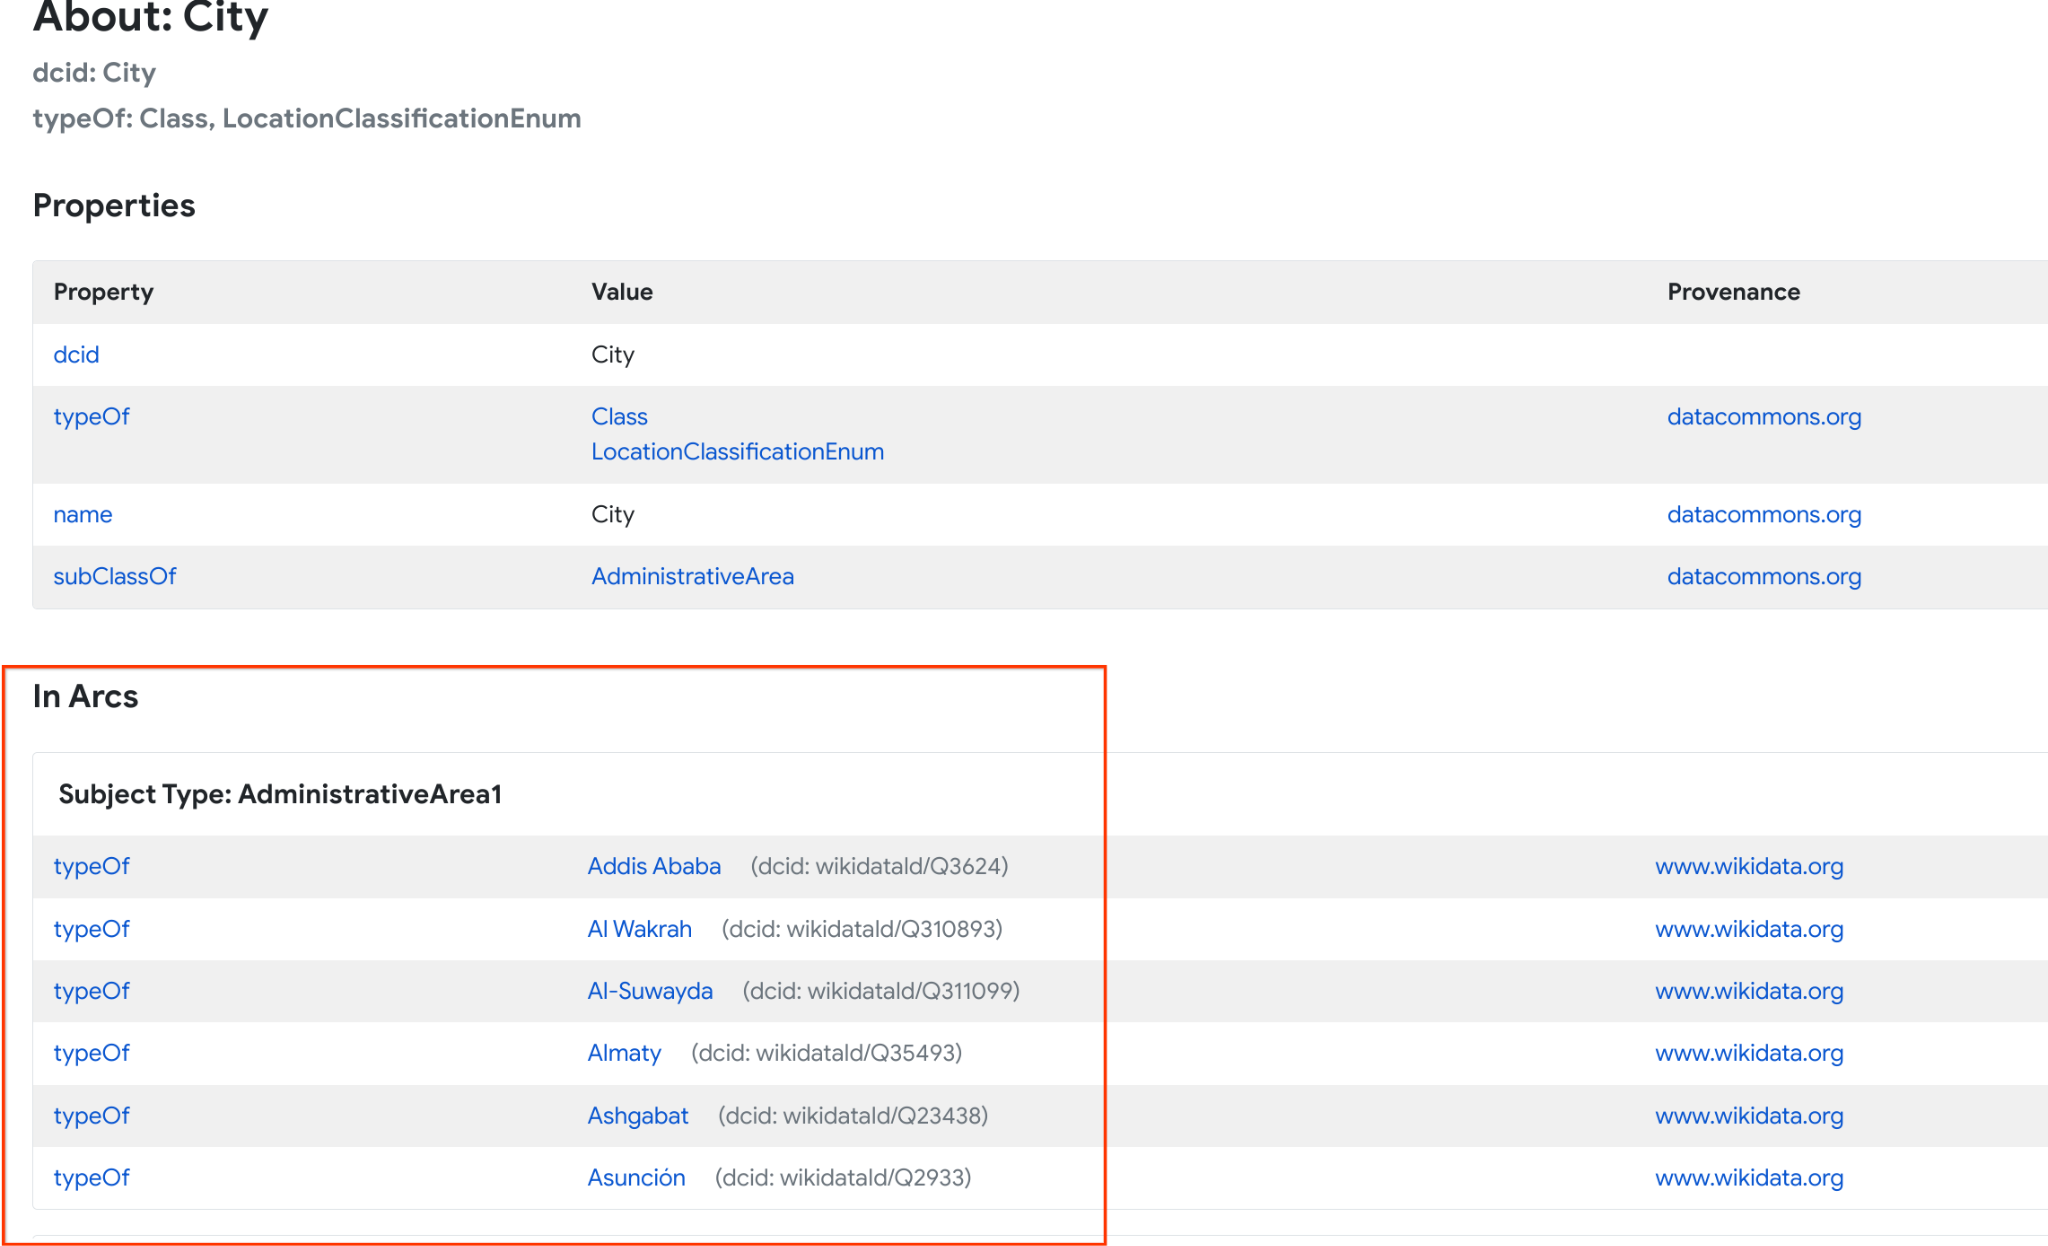
You can get information about a node and its edges by looking at the Knowledge Graph browser. If you know the DCID for a node, you can access it directly by typing https://datacommons.org/browser/DCID. For example, here is the entry for the City node, available at https://datacommons.org/browser/City:
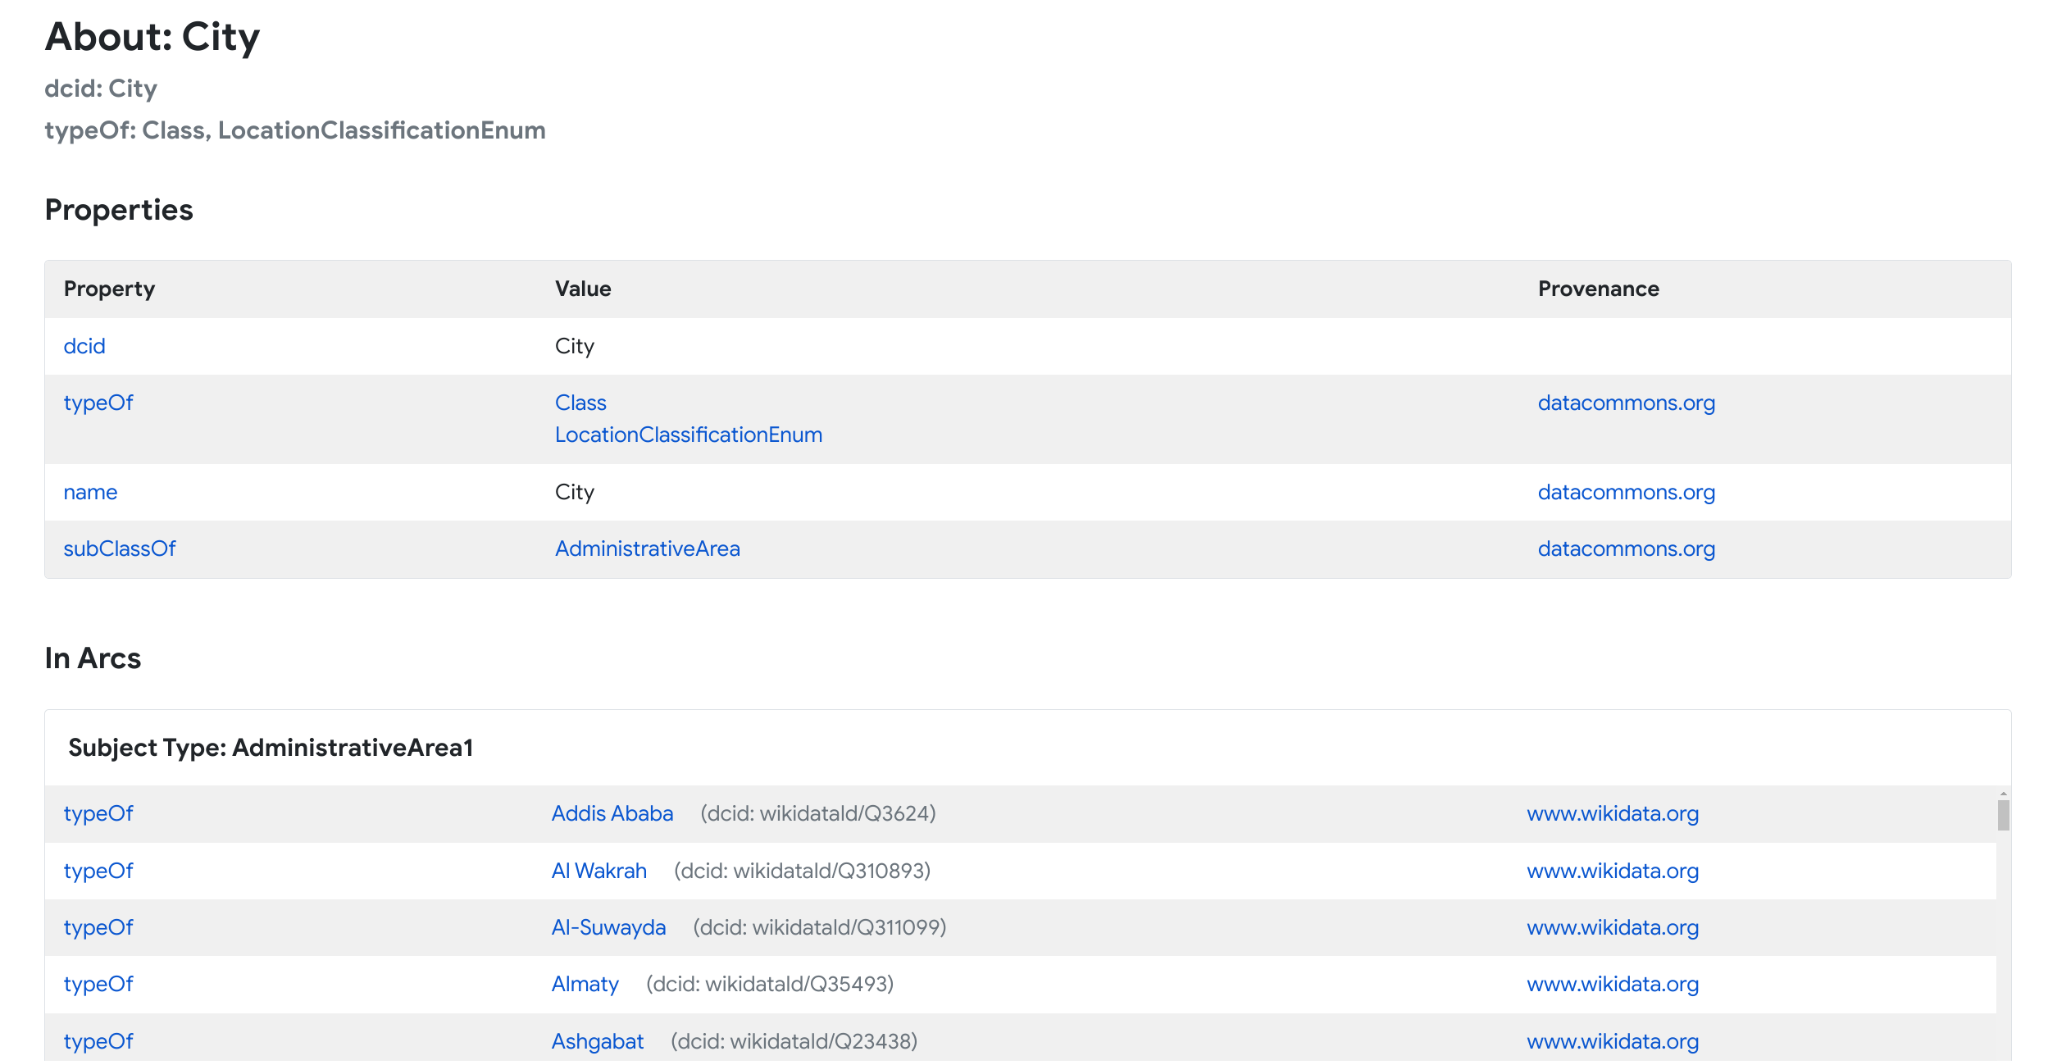
Every node entry shows a list of outgoing edges, or properties, and incoming edges. Properties are discussed in more detail below.
Type
Every node has at least one type, where each type may be a sub-class of multiple types. For entities and events, their type is typically another entity. For example, Berkeley is a type of City. At the root, all types are instances of the Class type. For statistical variables and observations, their type is always StatisticalVariable and StatVarObservation, respectively.
Entity
An entity represents a persistent, physical thing in the real world. While Data Commons has information about a wide variety of types of entities (cities, states, countries, schools, companies, facilities, etc.), most of the information today is about places. Data Commons contains a catalog of about 2.9 million places. In addition to basic metadata like the location, type and containment information, many places also contain information about their shape, area, etc. For a list of available place types, take a look at the place types page.
Event
An event is what it sounds like: an occurrence at a specific point in time, such as an extreme weather event, a criminal incident, an election, etc.
Statistical variable
In Data Commons, even statistical measurements and time series data are modeled as nodes. A statistical variable represents any type of metric, statistic, or measurement that can be taken at a place and time, such as a count, an average, a percentage, etc. A statistical variable for a specific place is a time series, consisting of a set of observed values over a time period.
Data Commons comprises hundreds of thousands of statistical variables, which you can view using the Statistical Variable Explorer.
The type of a statistical variable is always the special sub-class StatisticalVariable. For example, the metric Median Age of Female Population is a node whose type is a statistical variable.
A statistical variable can be simple, such as Total Population, or more complex, such as Hispanic Female Population. Complex variables may be broken down into constituent parts, or not.
Task: Find places available for a statistical variable
Note that not all statistical variables have observations for all places or other entities. To find out which places have data for a given variable, you can do the following:
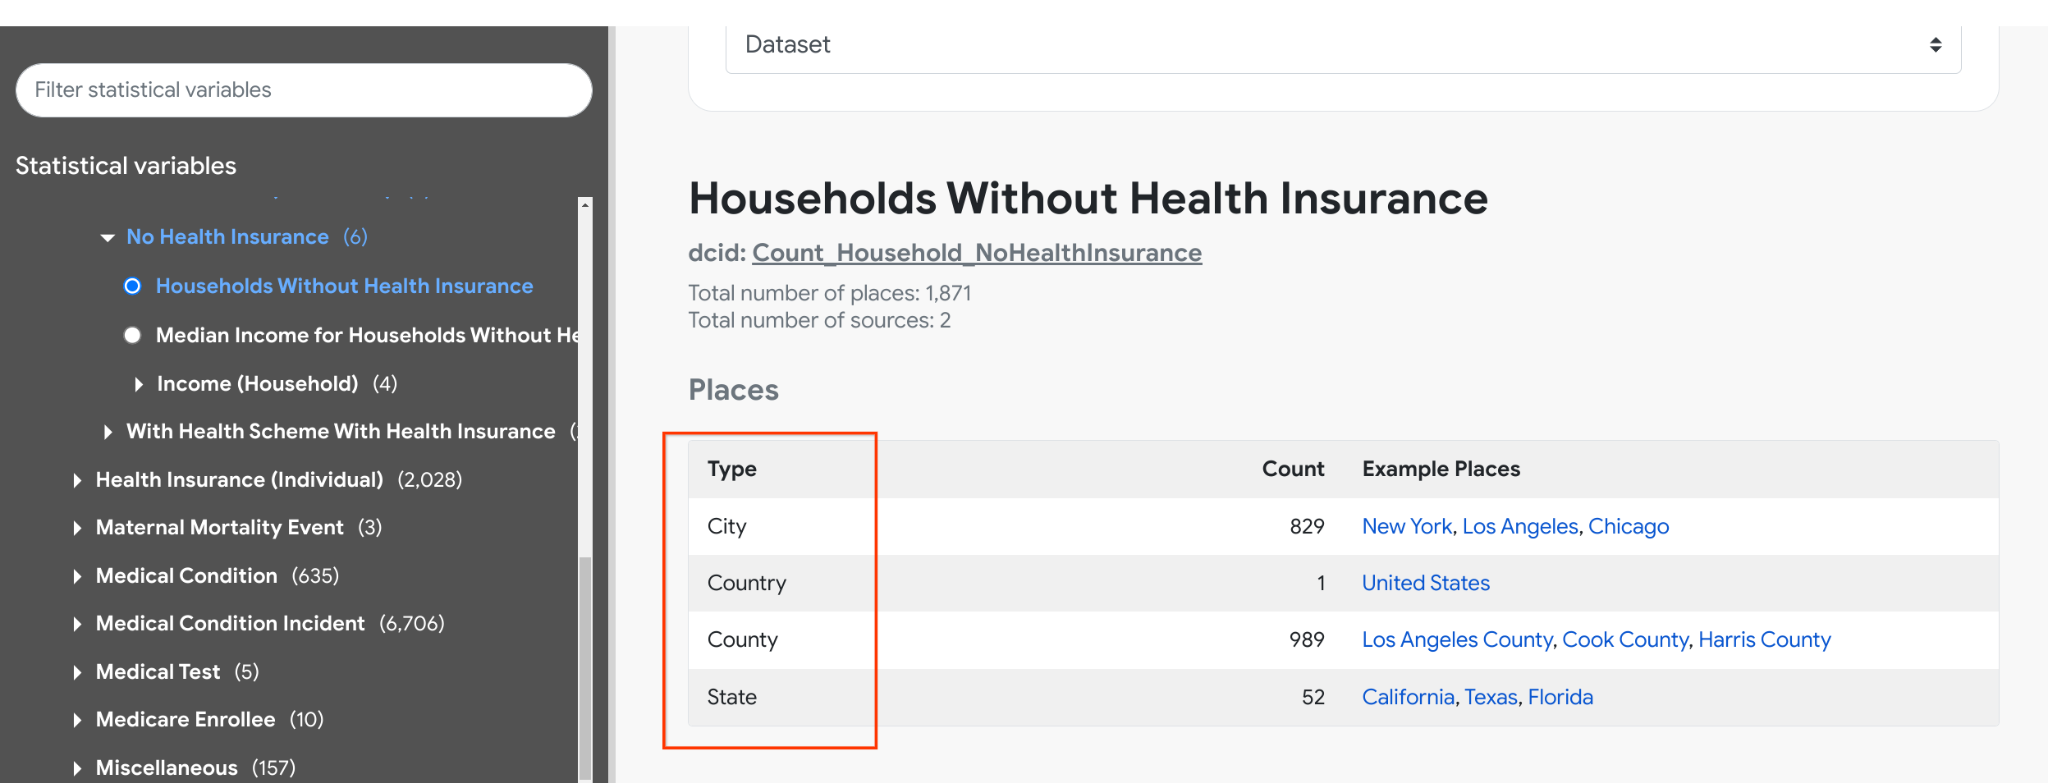
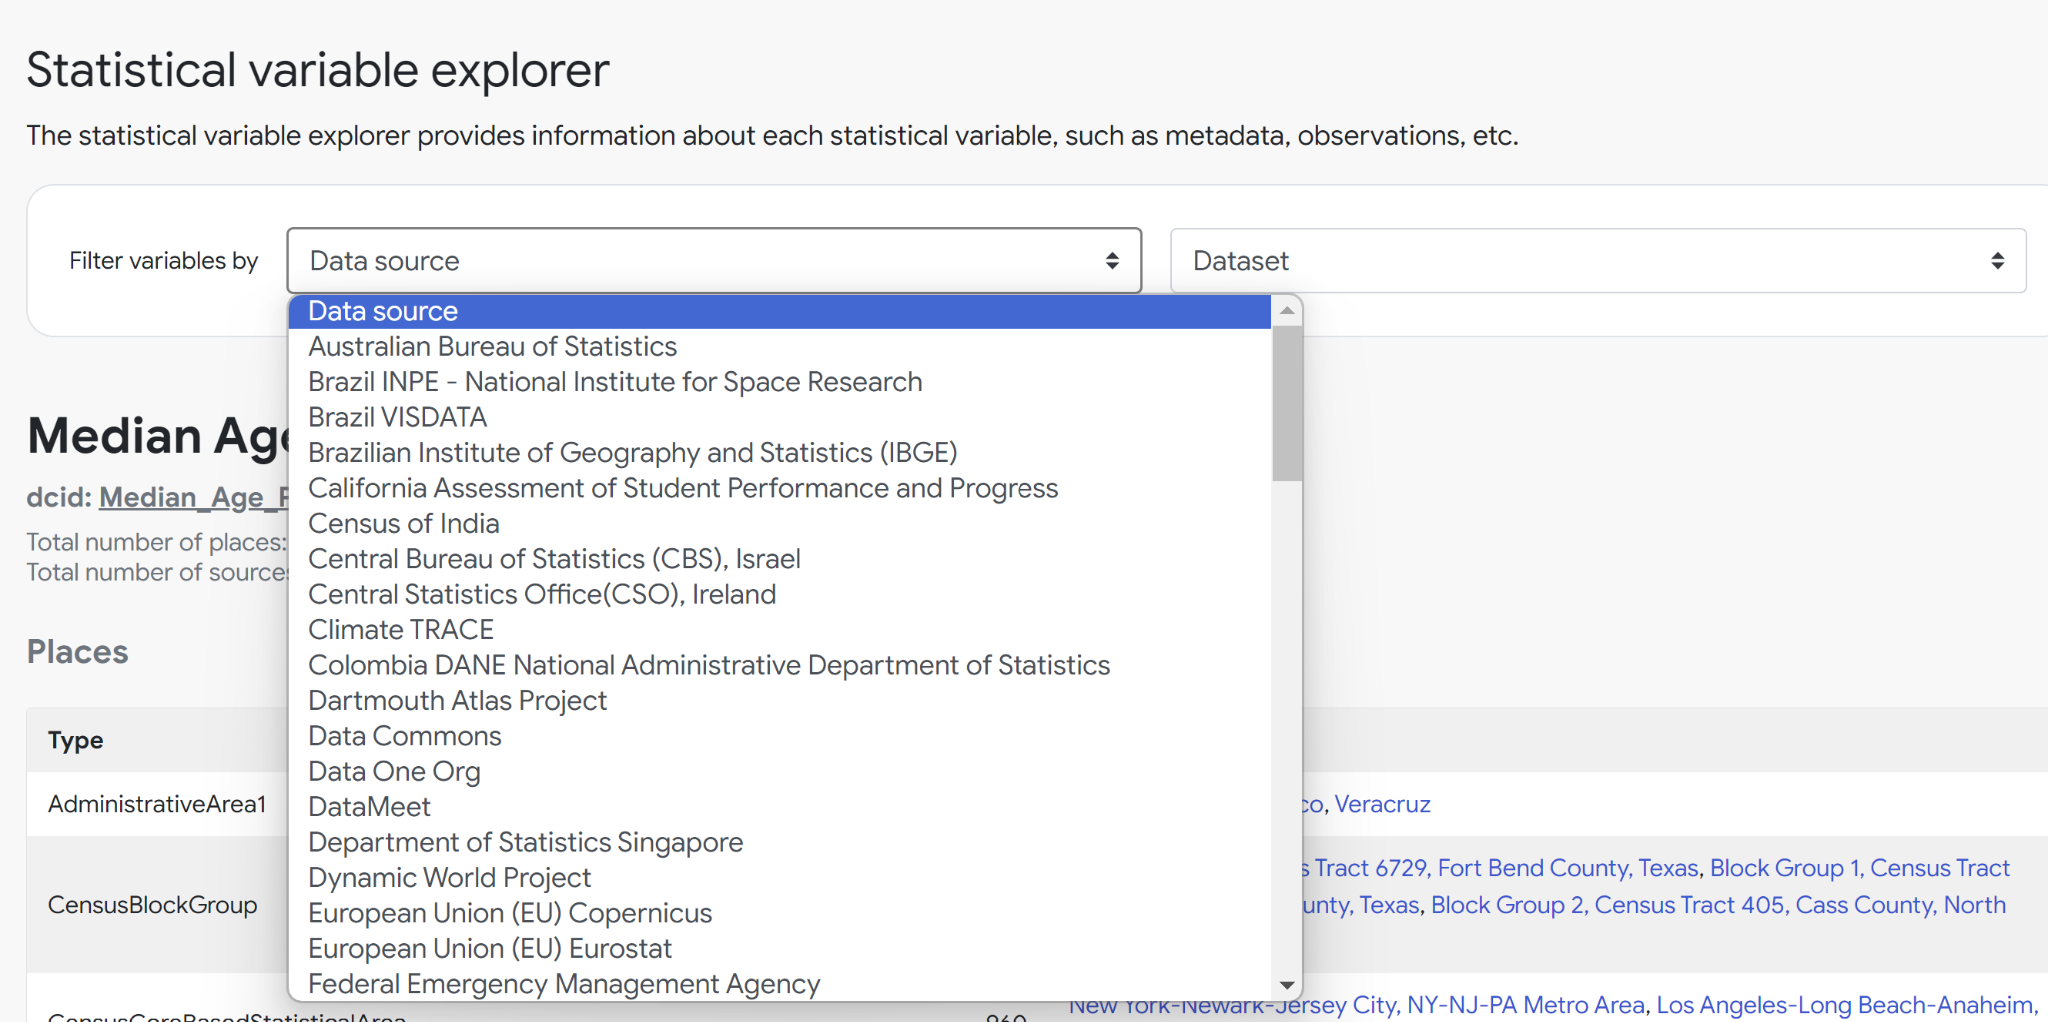
- Open the Statistical Variable Explorer, and search for a variable of interest.
- Optionally, filter by data source and data set.
- Scroll to the Places section.
For example, inspecting Health > Health Insurance (Household) > No Health Insurance > Households Without Health Insurance shows us that the statistical variable Count_Household_NoHealthInsurance is available in the United States at state, county, and city levels:
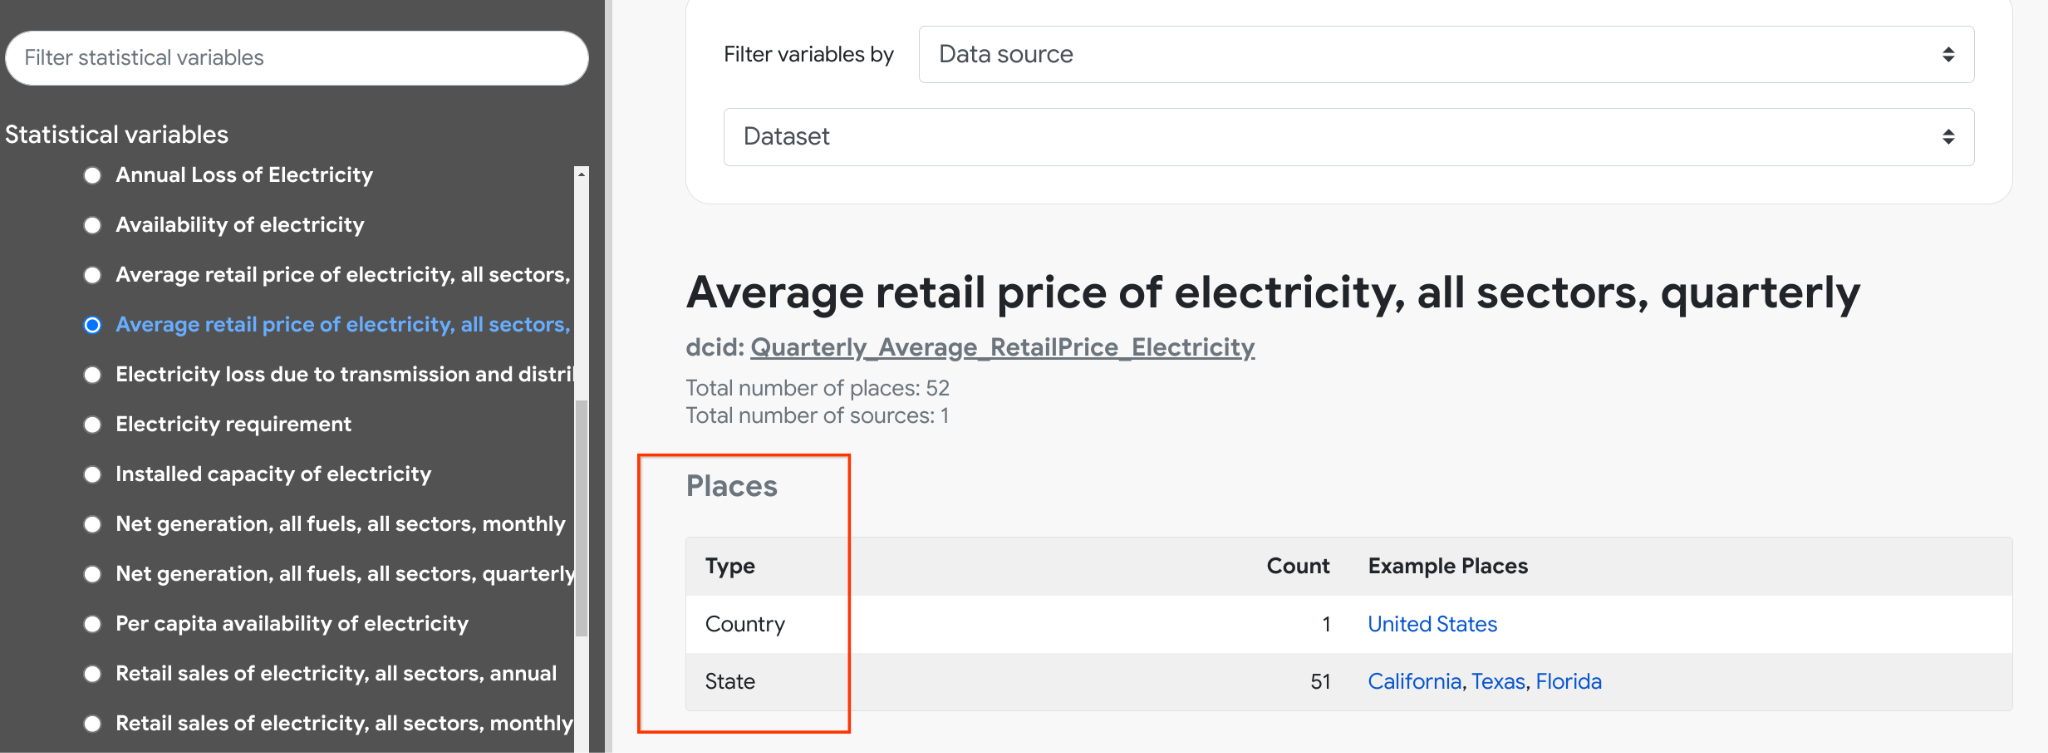
On the other hand, the Average Retail Price of Electricity, or Quarterly_Average_RetailPrice_Electricity, is only available at the state level states in the US but not at the city or county level.
Unique identifier: DCID
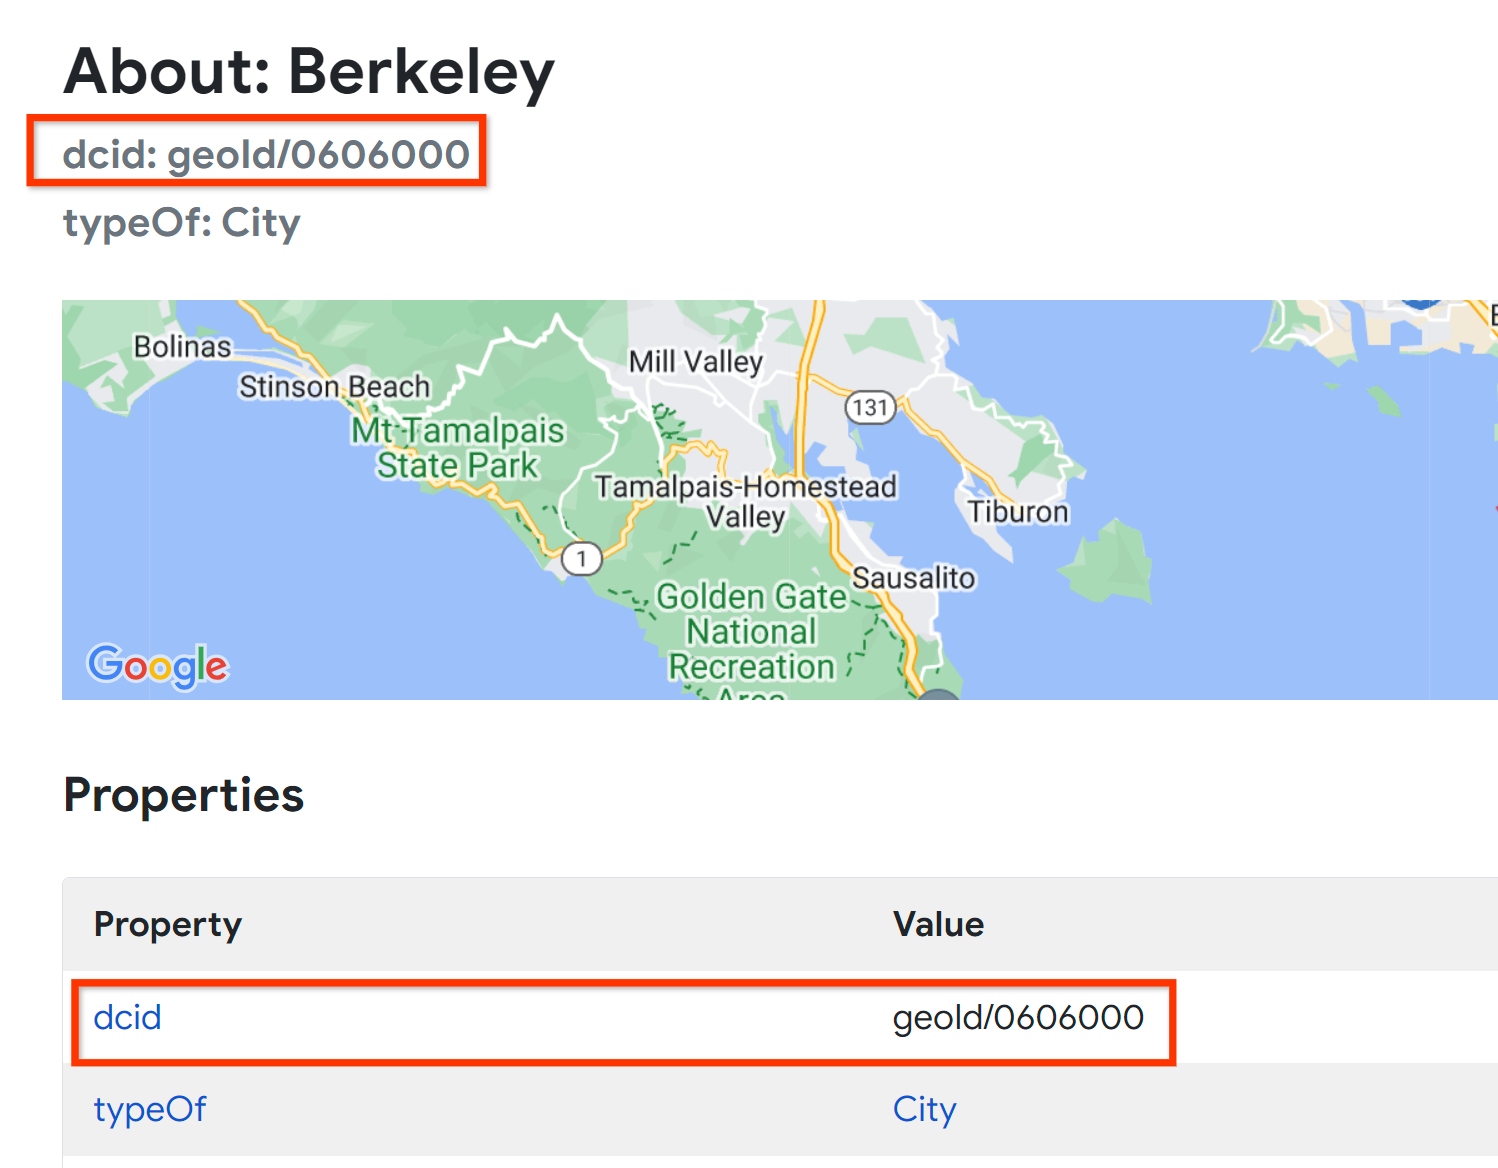
Every node has a unique identifier, called a Data Commons ID, or DCID. In the Knowledge Graph browser, you can view the DCID for any node or edge. For example, the DCID for the city of Berkeley is geoid/0606000:
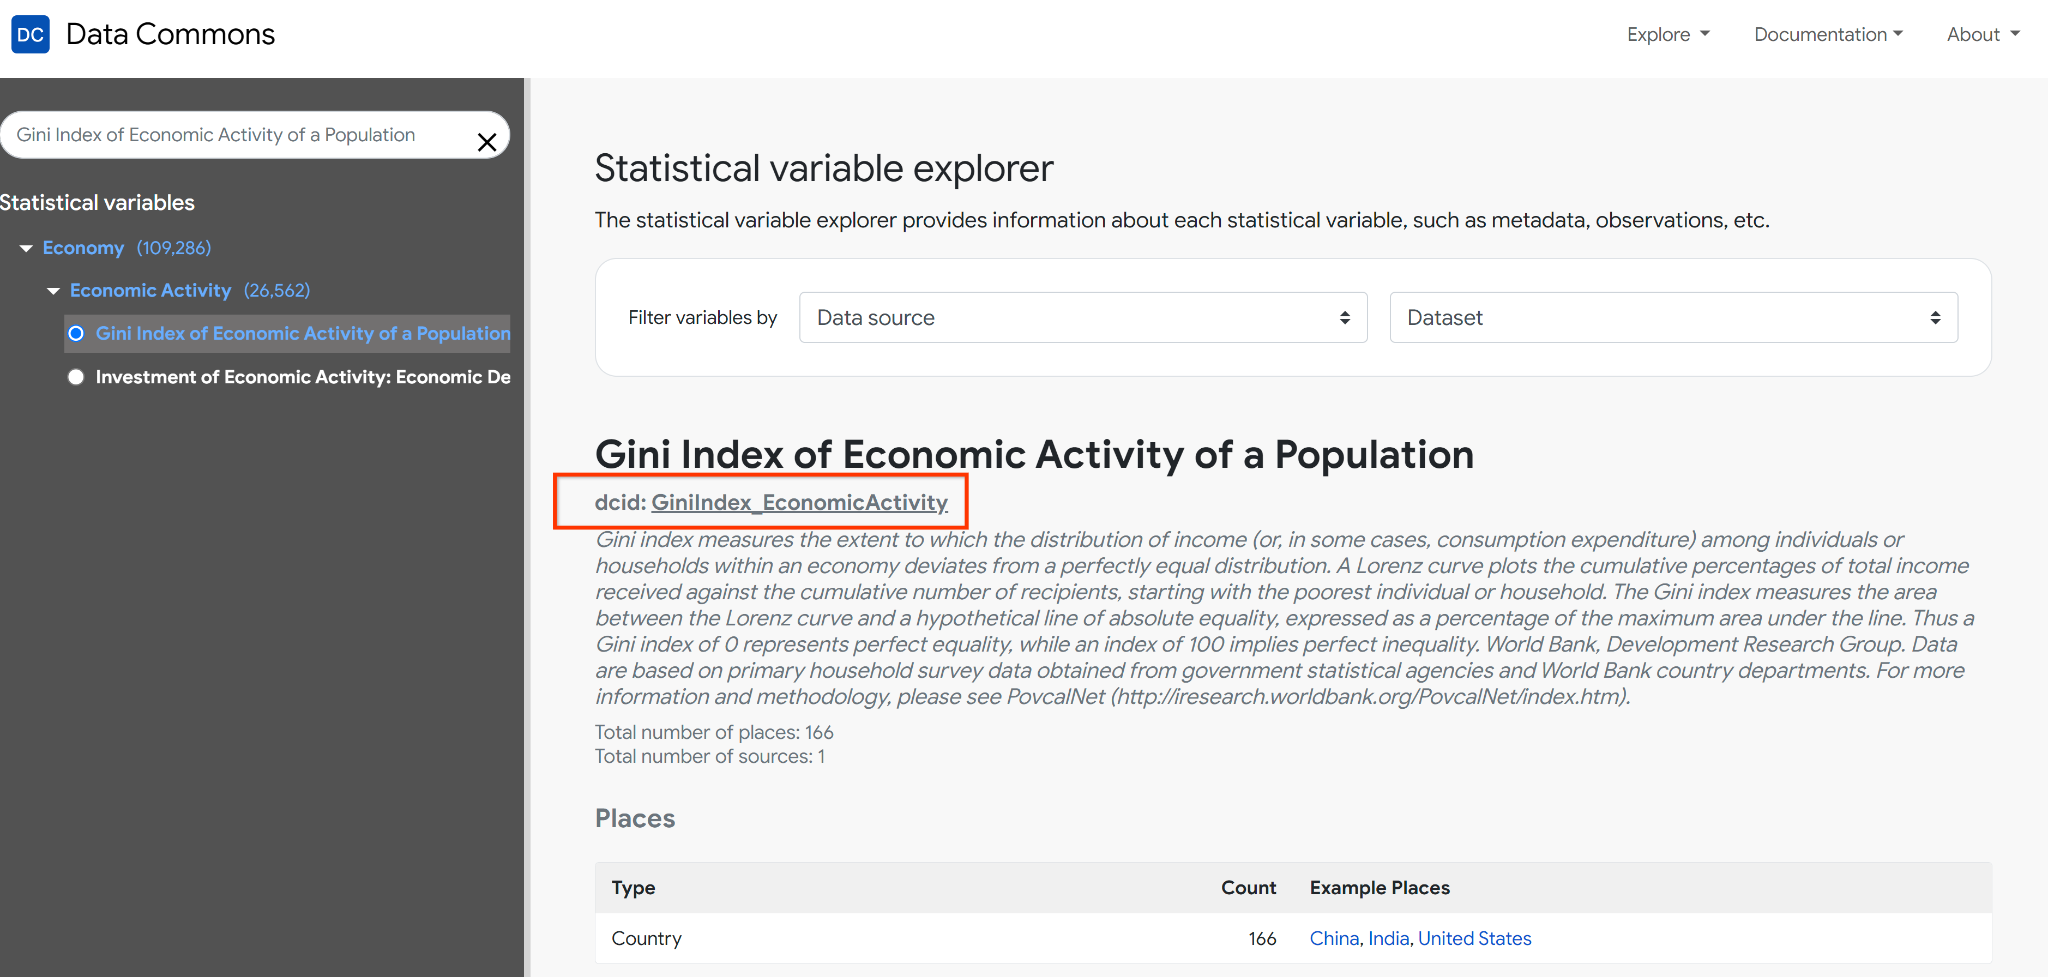
DCIDs are not restricted to entities; statistical variables also have DCIDs. For example, the DCID for the Gini Index of Economic Activity is GiniIndex_EconomicActivity:
Task: Find a DCID for an entity or variable
Many Data Commons tools and APIs require that you provide a DCID as input for a query. There are a few ways to do this.
To find the DCID for a place using the datacommons.org website:
- Go to https://docs.datacommons.org/place_types.html.
- Click the link on the place type of interest and click its link to open the Knowledge Graph page for the entity; for example, City.
- Scroll to the In Arcs section to look up the places of interest.
- If necessary, continue to drill down on links until you find the place of interest.
To find the DCID for a place using other methods:
- Use the Google Sheets add-on Fill place dcids feature.
- Use the REST v2 Resolve API, either interactively (e.g. using curl or the browser address bar) or programmatically.
- Use the Python v2
resolve.fetch_dcids_by_nameAPI method, either interactively or programmatically.
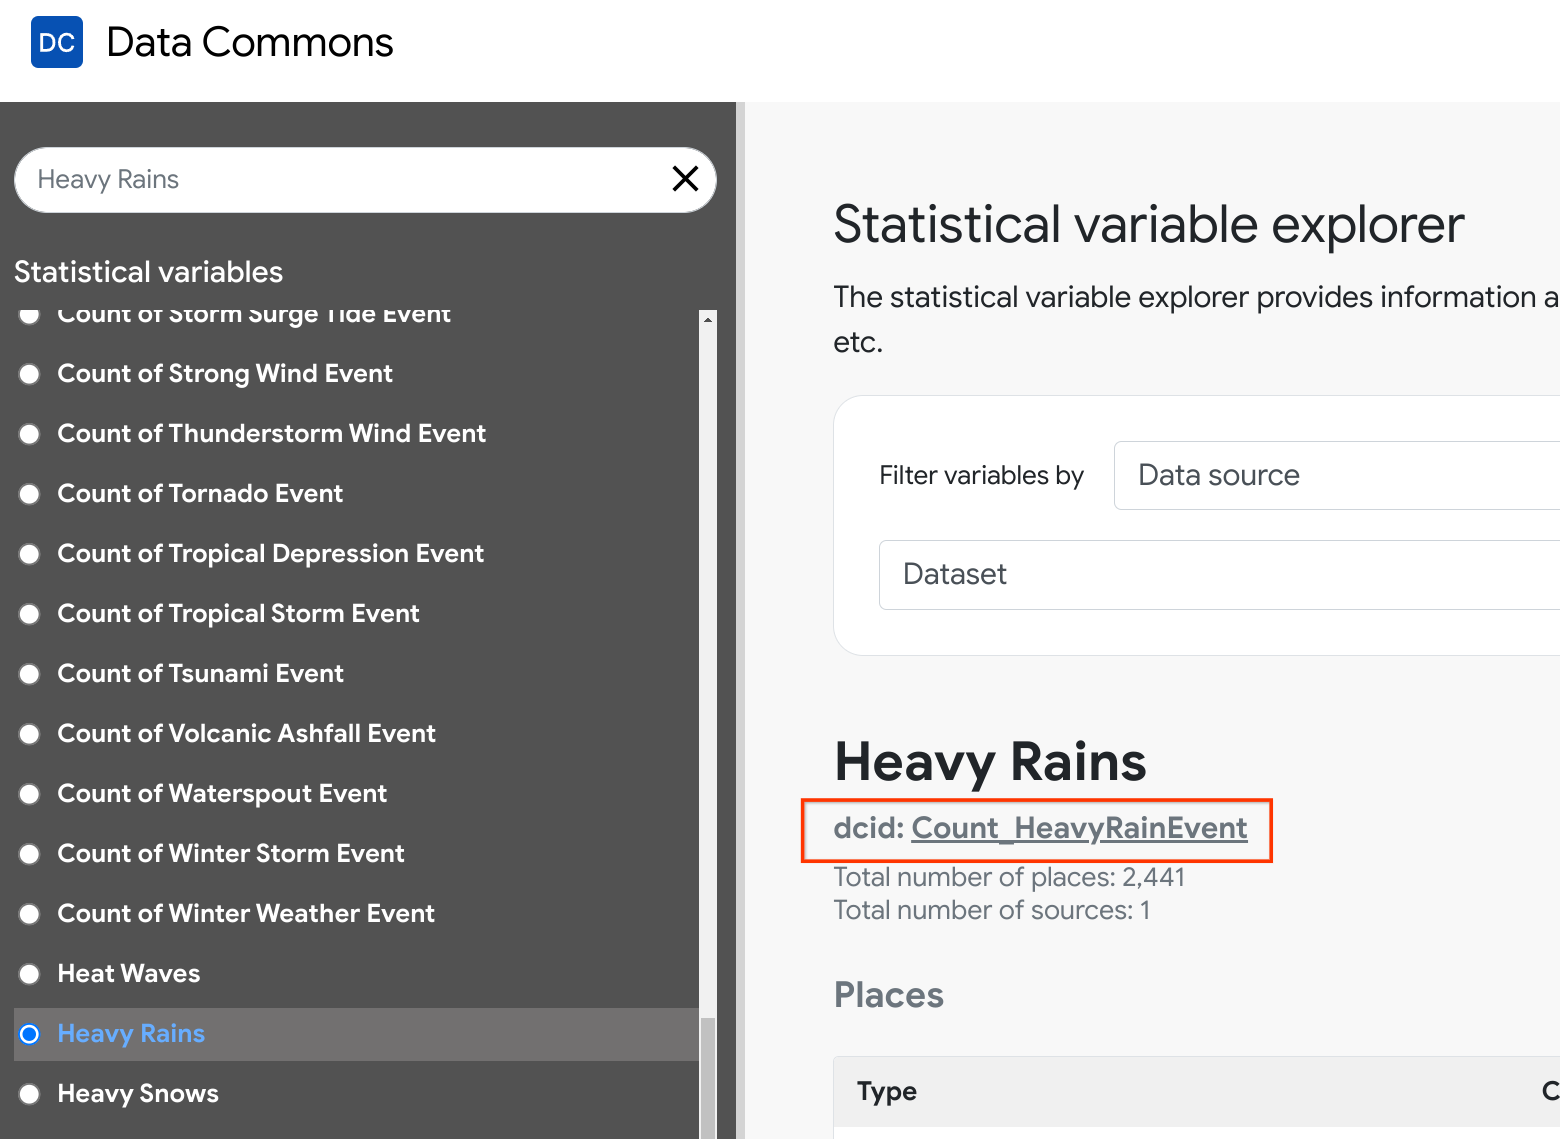
To find the DCID for a statistical variable using the datacommons.org website:
- Open the Statistical Variable Explorer.
- Search for the variable of interest, and optionally filter by data source and dataset.
- Look under the heading for the DCID.
To find the DCID for a statistical variable using other methods:
- Use the REST v2 Resolve API with the
resolver=indicatoroption. - Use the Python v2
resolve.fetch_indicatorsAPI method.
Property
Every node also contains properties or characteristics that describe its entity, event, or statistical variable. Each property is actually an edge to another node, with a label. If the object node is a primitive type, such as a string, date, or number, it is a “leaf”, or terminal node, which we call an attribute. Examples are properties such as latitude, year, various unique IDs and so on.
Other properties are links to other entities/events/ etc. In the Knowledge Graph, you can click through links to non-terminal nodes.
For example, in this node for the city of Addis Ababa, Ethiopia, the typeOf and containedInPlace edges link to other entities, namely City and Ethiopia, whereas all the other values are terminal.
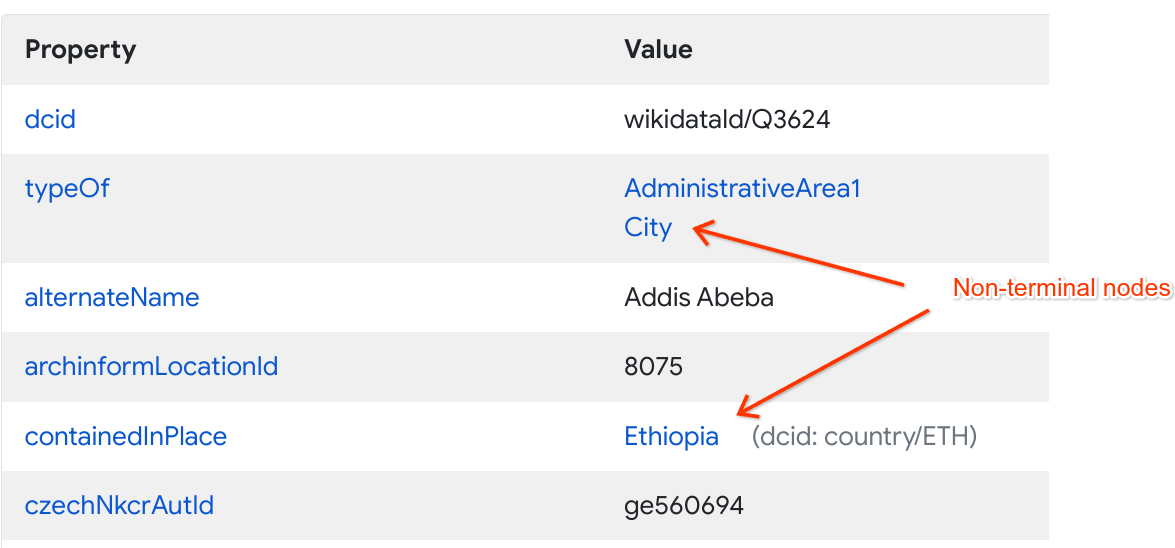
Note that the DCID for a property is the same as its name.
Observation
An observation is a single measured value for a statistical variable, at or during a specified period of time, for a specific entity.
For example, the value of the statistical variable Median Age of Female Population for the city of San Antonio, Texas in 2014 could have an observation Observation_Median_Age_Person_Female_SanAntonio_TX_2014. The type of an observation is always the special sub-class StatVarObservation.
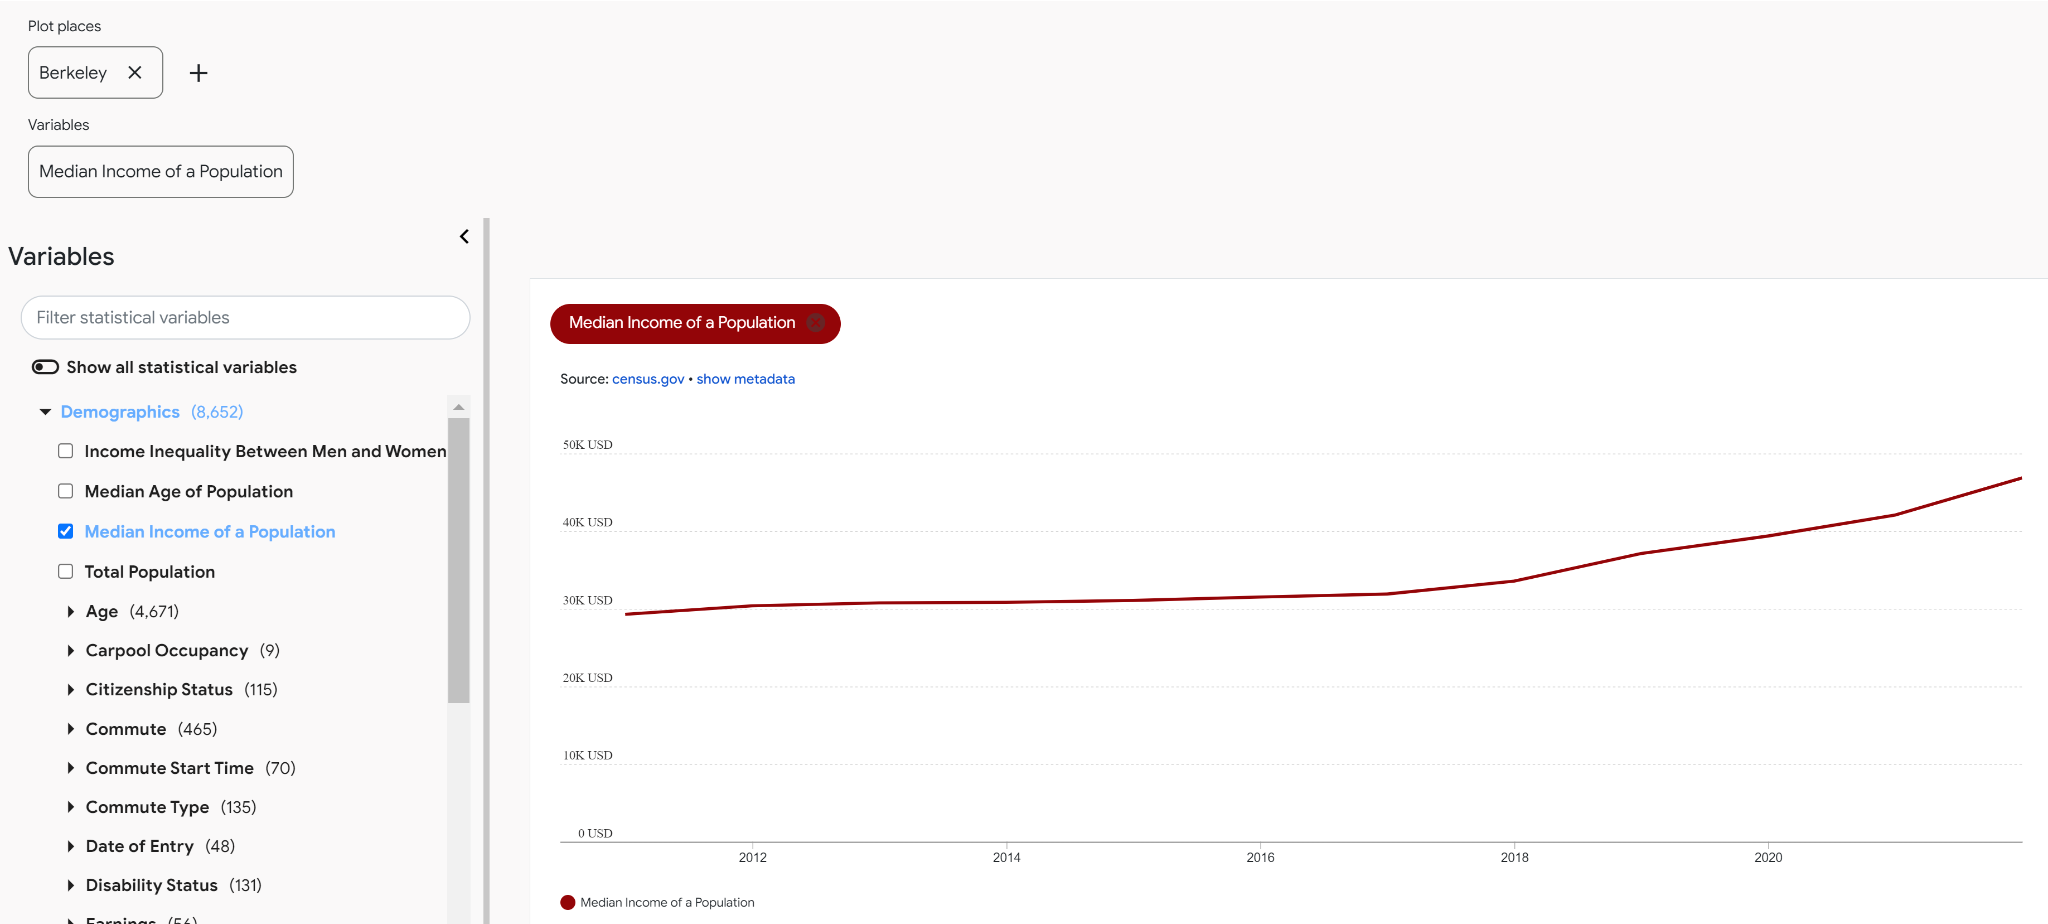
Time series made up of many observations underlie the data available in the Timeline Explorer and timeline graphs. For example, here is the median income in Berkeley, CA over a period of ten years, according to the US Census Bureau:
Provenance, Source, Dataset
Every node and triple also have some important properties that indicate the origin of the data.
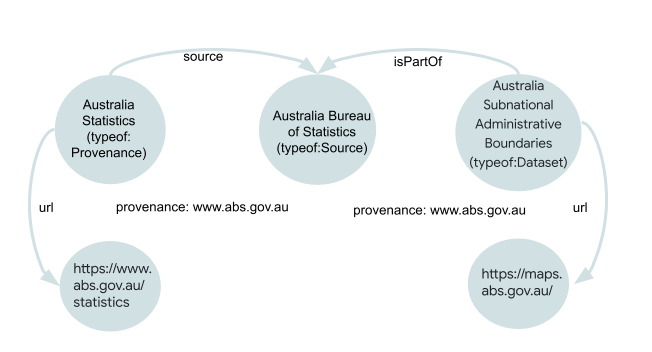
Source: This is the organization that provides the data, and is usually specified as the name of the organization; for example, Australian Bureau of Statistics.Dataset: This is the name of a specific dataset provided by a source. In relational database terminology, adatasetroughly corresponds to a “database”. Many sources provide multiple datasets. For example, the source Australian Bureau of Statistics provides two datasets, Australia Statistics, and Australia Subnational Administrative Boundaries.-
Provenance: A provenance is a subset of a dataset. For small datasets, it may represent the entire dataset. For example, Sweden Census is both a dataset and a provenance.For larger datasets, a provenance usually represents a subset of the dataset, roughly corresponding to a “table” in relational database terminology. Thus, there may be several provenances for a given dataset. For example, Brazil VIS DATA 3 is a dataset that comprises 2 provenances: Brazil Food Distribution and Brazil Rural Development Program.
In Data Commons, a provenance is the physical unit of an import, and thus contains detailed import information. A dataset is more of an abstract concept; each provenance has a property that points to the dataset it belongs to.
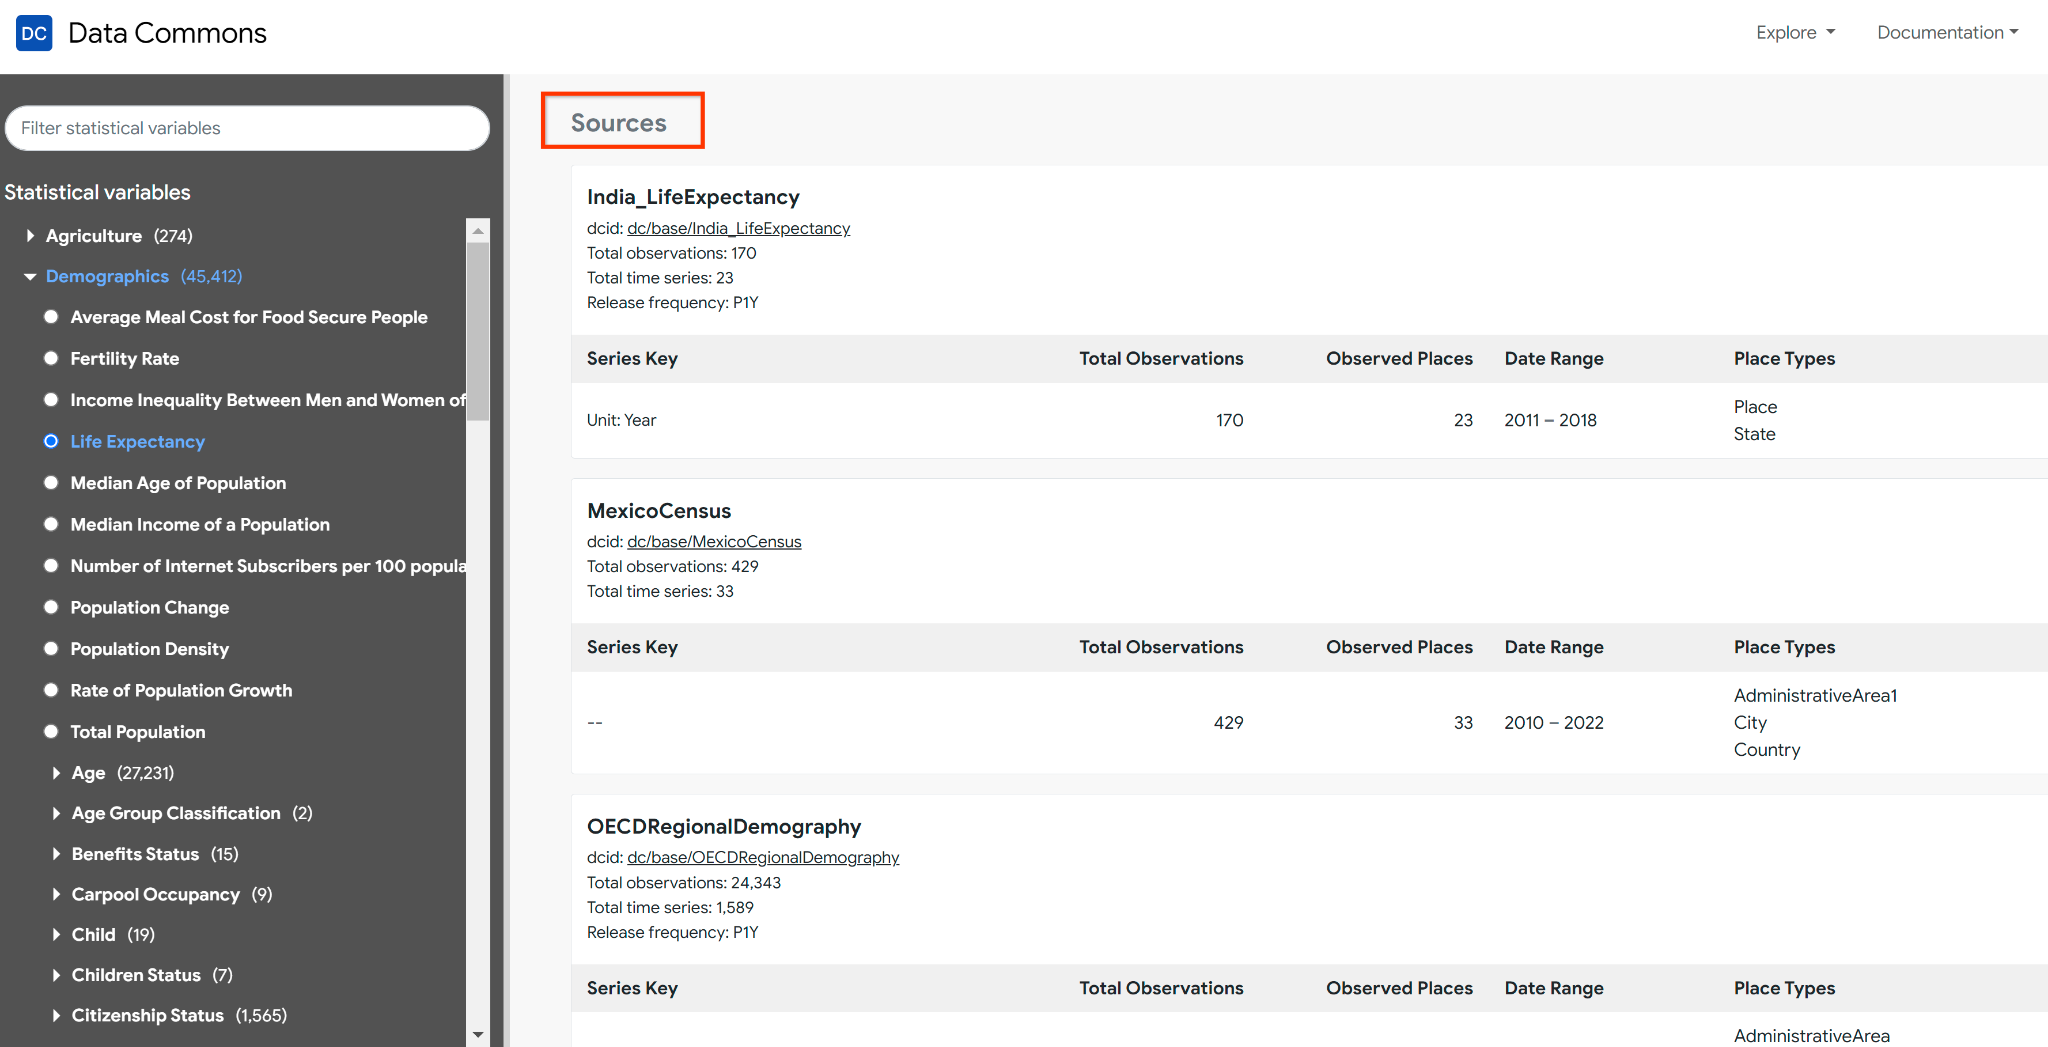
Note that a given statistical variable may have multiple provenances, since many data sets define the same variables. You can see the list of all the data sources for a given statistical variable in the Statistical Variable Explorer. For example, the explorer shows multiple sources (Censuses from India, Mexico, Vietnam, OECD, World Bank, etc.) for the variable Life Expectancy:
You can see a list of all sources and data sets in several places:
- The Data Sources pages
- The Data source and Dataset drop-down menus in the Statistical Variable Explorer
Page last updated: July 06, 2026 • Send feedback about this page