Quickstart
This page shows you how to run a local custom Data Commons instance inside Docker containers and load sample custom data from a local SQLite database. A custom Data Commons instance uses code from the public open-source repo, available at https://github.com/datacommonsorg/.
This is step 1 of the recommended workflow.
- System overview
- Prerequisites
- One-time setup steps
- About the downloaded files
- Look at the sample data
- Load sample data and start the services
- View the local website
- Send an API request
- Docker commands
- Troubleshooting
System overview
The instructions in this page use the following setup:
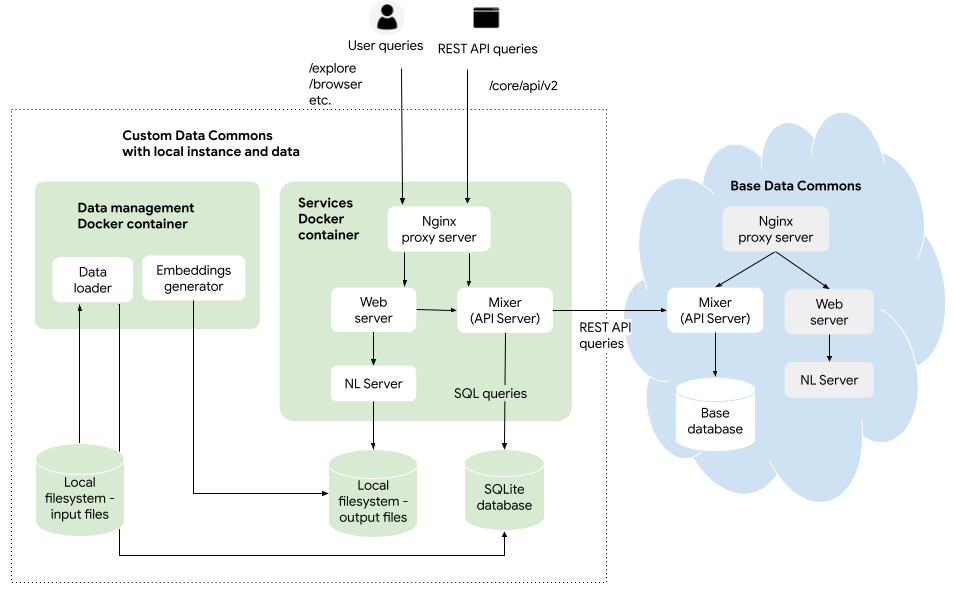
The “data management” Docker container consists of scripts that do the following:
- Convert custom CSV file data into SQL tables and store them in a data store – for now, in a local SQLite database
- Generate NL embeddings for custom data and store them – for now, in the local file system
The “services” Docker container consists of the following Data Commons components:
- A Nginx reverse proxy server, which routes incoming requests to the web or API server
- A Python-Flask web server, which handles interactive requests from users
- An Python-Flask NL server, for serving natural language queries
- An MCP server, for serving tool responses to an MCP-compliant AI agent (e.g. Google ADK apps, Gemini CLI, Google Antigravity)
- A Go Mixer, also known as the API server, which serves programmatic requests using Data Commons APIs. The SQL query engine is built into the Mixer, which sends queries to both the local and remote data stores to find the right data. If the Mixer determines that it cannot fully resolve a user query from the custom data, it will make a REST API call, as an anonymous “user” to the base Data Commons Mixer and data.
Prerequisites
- Obtain a GCP account and project.
- If you are developing on Windows, install WSL 2 (any distribution will do, but we recommend the default, Ubuntu), and enable WSL 2 integration with Docker.
- Install Docker Desktop/Engine.
- Install Git.
Tip: If you use Google Cloud Shell as your development environment, Git and Docker come pre-installed.
- Optional: Get a Github account, if you would like to browse the Data Commons source repos using your browser.
One-time setup steps
Get a Data Commons API key
An API key is required to authorize requests from your site to the base Data Commons site. API keys are managed by a self-serve portal. To obtain an API key, go to https://apikeys.datacommons.org and request a key for the api.datacommons.org domain.
Enable Google Cloud APIs and get a Maps API key
- Go to https://console.cloud.google.com/apis/dashboard for your project.
- Click Enable APIs & Services.
- Under Maps, enable Places API and Maps Javascript API.
- Go to https://console.cloud.google.com/google/maps-apis/credentials for your project.
- Click Create Credentials > API Key.
- Record the key and click Close.
- From the drop-down menu, enable Places API and Maps Javascript API. (Optionally enable other APIs for which you want to use this key.)
- Click OK and Save.
Clone the Data Commons repository
Note: If you are using WSL on Windows, open the Linux distribution app as your command shell. You must use the Linux-style file structure for Data Commons to work correctly.
- Open a terminal or Cloud Shell window, and go to a directory to which you would like to download the Data Commons repository.
- Clone the website Data Commons repository:
git clone https://github.com/datacommonsorg/website.git [DIRECTORY]
If you don’t specify a directory name, this creates a local
websitesubdirectory. If you specify a directory name, all files are created under that directory, without awebsitesubdirectory.
When the downloads are complete, navigate to the root directory of the repo (e.g. website). References to various files and commands in these procedures are relative to this root.
cd website
Set environment variables
- Using your favorite editor, copy
custom_dc/env.list.sampleand save it as a new filecustom_dc/env.list. It provides a template for getting started. - Enter the relevant values for
DC_API_KEYandMAPS_API_KEY. - Set
INPUT_DIRto the full path to thewebsite/custom_dc/sample/directory. For example if you have cloned the repo directly to your home directory, this might be/home/USERNAME/website/custom_dc/sample/. (If you’re not sure, typepwdto get the working directory.) - For
OUTPUT_DIR, set it to the same path as theINPUT_DIR. - If you are using Google Cloud Shell as your environment, set
GOOGLE_CLOUD_PROJECTto your project ID. - For now, leave all the other defaults.
Warning: Do not use any quotes (single or double) or spaces when specifying the values.
About the downloaded files
| Directory/file | Description |
|---|---|
run_cdc_dev_docker.sh |
A convenience shell script to simplify management of Docker commands. Throughout the pages in this guide, we reference this script as well as giving the underlying commands. Documentation for running the script is available at the top of the file or by running ./run_cdc_dev_docker.sh --help from the root website directory. |
custom_dc/sample/ |
Sample data and config file (`config.json`) that can be added to a Custom Data Commons. This page describes the model and format of this data and how you can load and view it. |
deploy/terraform-custom-datacommons |
Contains Terraform and convenience shell scripts for setting up your instance on Google Cloud Platform. See Deploy your custom instance to Google Cloud for complete details. |
Additional files, that control the site user interface, are described in Customize the site.
Look at the sample data
Before you start up a Data Commons site, it’s important to understand the basics of the data model that is expected in a custom Data Commons instance. Let’s look at the sample data in the CSV files in the custom_dc/sample/ folder. This data is from the Organisation for Economic Co-operation and Development (OECD): “per country data for annual average wages” and “gender wage gaps”:
| entity | date | variable | value | unit |
|---|---|---|---|---|
| country/BEL | 2000 | average_annual_wage | 54577.62735 | USD |
| country/BEL | 2001 | average_annual_wage | 54743.96009 | USD |
| country/BEL | 2002 | average_annual_wage | 56157.24355 | USD |
| country/BEL | 2003 | average_annual_wage | 56491.99591 | USD |
| … | … | … | … | … |
| entity | date | variable | value | unit |
|---|---|---|---|---|
| country/DNK | 2005 | gender_wage_gap | 10.16733044 | percent |
| country/DNK | 2006 | gender_wage_gap | 10.17206126 | percent |
| country/DNK | 2007 | gender_wage_gap | 9.850297951 | percent |
| country/DNK | 2008 | gender_wage_gap | 10.18354903 | percent |
| … | … | … | … | … |
There are a few important things to note:
- There are only 4 required columns: one representing a place or “entity”, identified by a unique Data Commons identifier (“DCID”); one representing a date; one representing a statistical variable, which is a Data Commons concept for a metric; and one representing the value of the variable.
- Every row is a separate observation. An observation is a value of the variable for a given place and time. There could be multiple different variables in a given CSV file (and these two files could actually be combined into one).
- There is an additional, optional column,
unit, that provides more details about each observation.
This is the format to which your data must conform for correct loading. (This topic is discussed in detail in Preparing and loading your data.)
Load sample data and start the services
To start up Data Commons:
- If you are running on Windows or Mac, start Docker Desktop and ensure that the Docker Engine is running.
Note: If you are running on Linux, depending on whether you have created a “sudoless” Docker group, you may need to preface every script or
dockerinvocation withsudo.
-
Open a terminal window, and from the website root directory, run the following command to run the Docker containers:
  cd website
  ./run_cdc_dev_docker.sh
This does the following:
- The first time you run it, downloads the latest stable Data Commons data image,
gcr.io/datcom-ci/datacommons-data:stable, and services image,gcr.io/datcom-ci/datacommons-services:stable, from the Google Cloud Artifact Registry, which may take a few minutes. Subsequent runs use the locally stored images. - Maps the input sample data to a Docker path.
- Starts the Docker data management container.
- Imports the data from the CSV files, resolves entities, and writes the data to a SQLite database file,
custom_dc/sample/datacommons/datacommons.db. - Generates embeddings in
custom_dc/sample/datacommons/nl. (To learn more about embeddings generation, see the FAQ). - Starts the services Docker container.
- Starts development/debug versions of the Web server, MCP server, NL server, and Mixer, as well as the Nginx proxy, inside the container.
- Maps the output sample data to a Docker path.
You can see the actual Docker commands that the script runs at the end of this page.
Stop and restart the services
If you need to restart the services for any reason, do the following:
- In the terminal window where the container is running, press Ctrl-c to kill the Docker container.
- Run the script with the option to restart only the services container:
./run_cdc_dev_docker.sh -c service
Tip: If you closed the terminal window in which you started the Docker services container, you can kill it as follows:
- Open another terminal window, and from the root directory, get the Docker container ID.
docker psThe
CONTAINER IDis the first column in the output. - Run:
docker kill CONTAINER_ID
View the local website
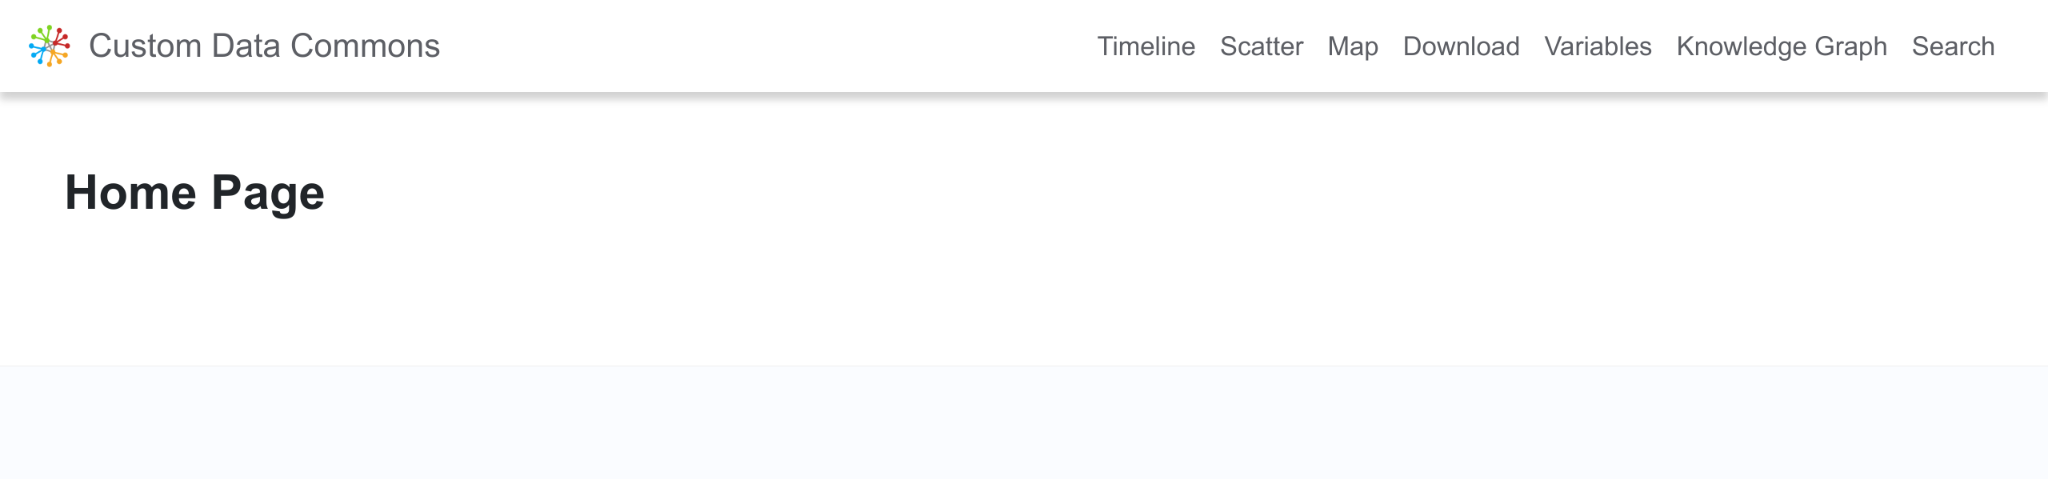
Once the services are up and running, visit your local instance by pointing your browser to http://localhost:8080. You should see something like this:
Now click the Statistical Variable Explorer chip to show the Statistical Variable Explorer. You should see the new OECD group of variables at the top of the left pane. Select one of them and you will see some linked sample countries that have data for these variables.
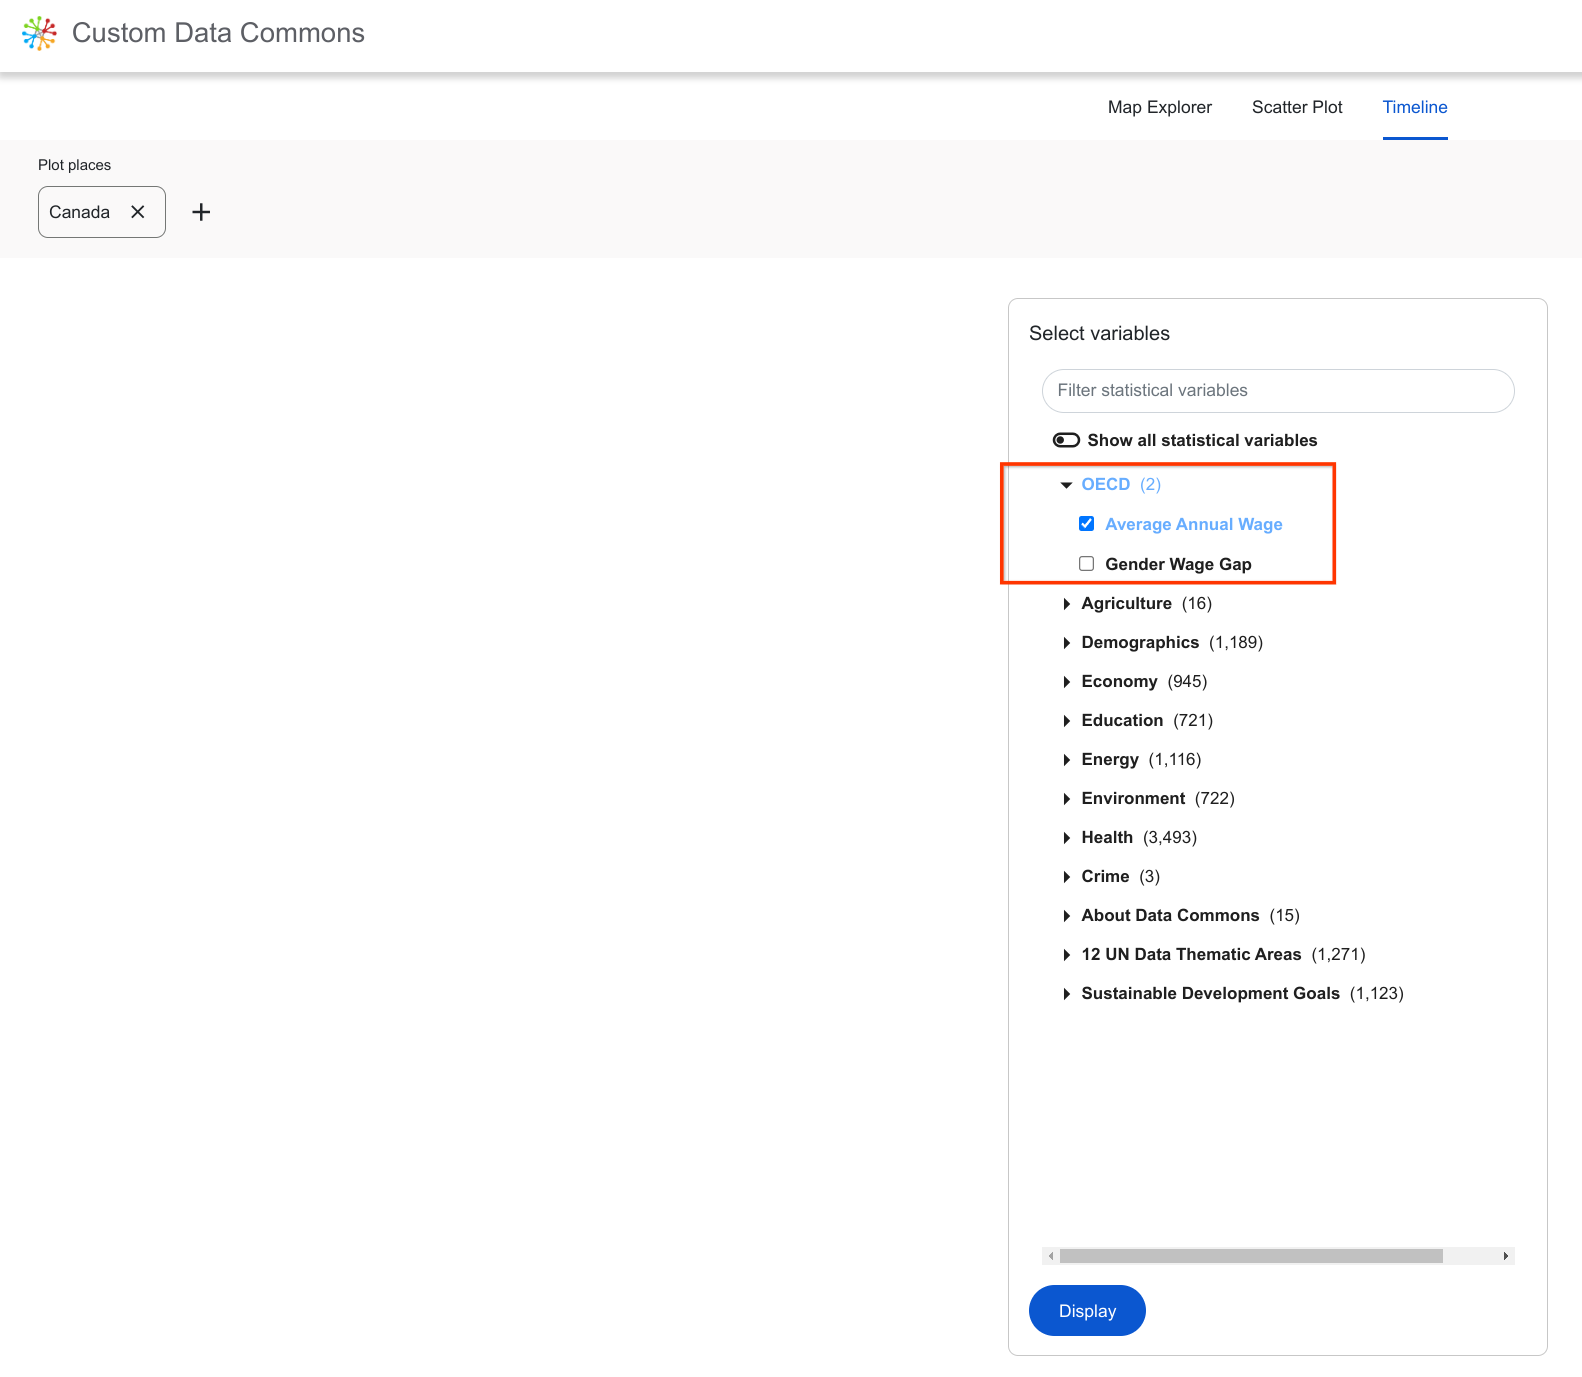
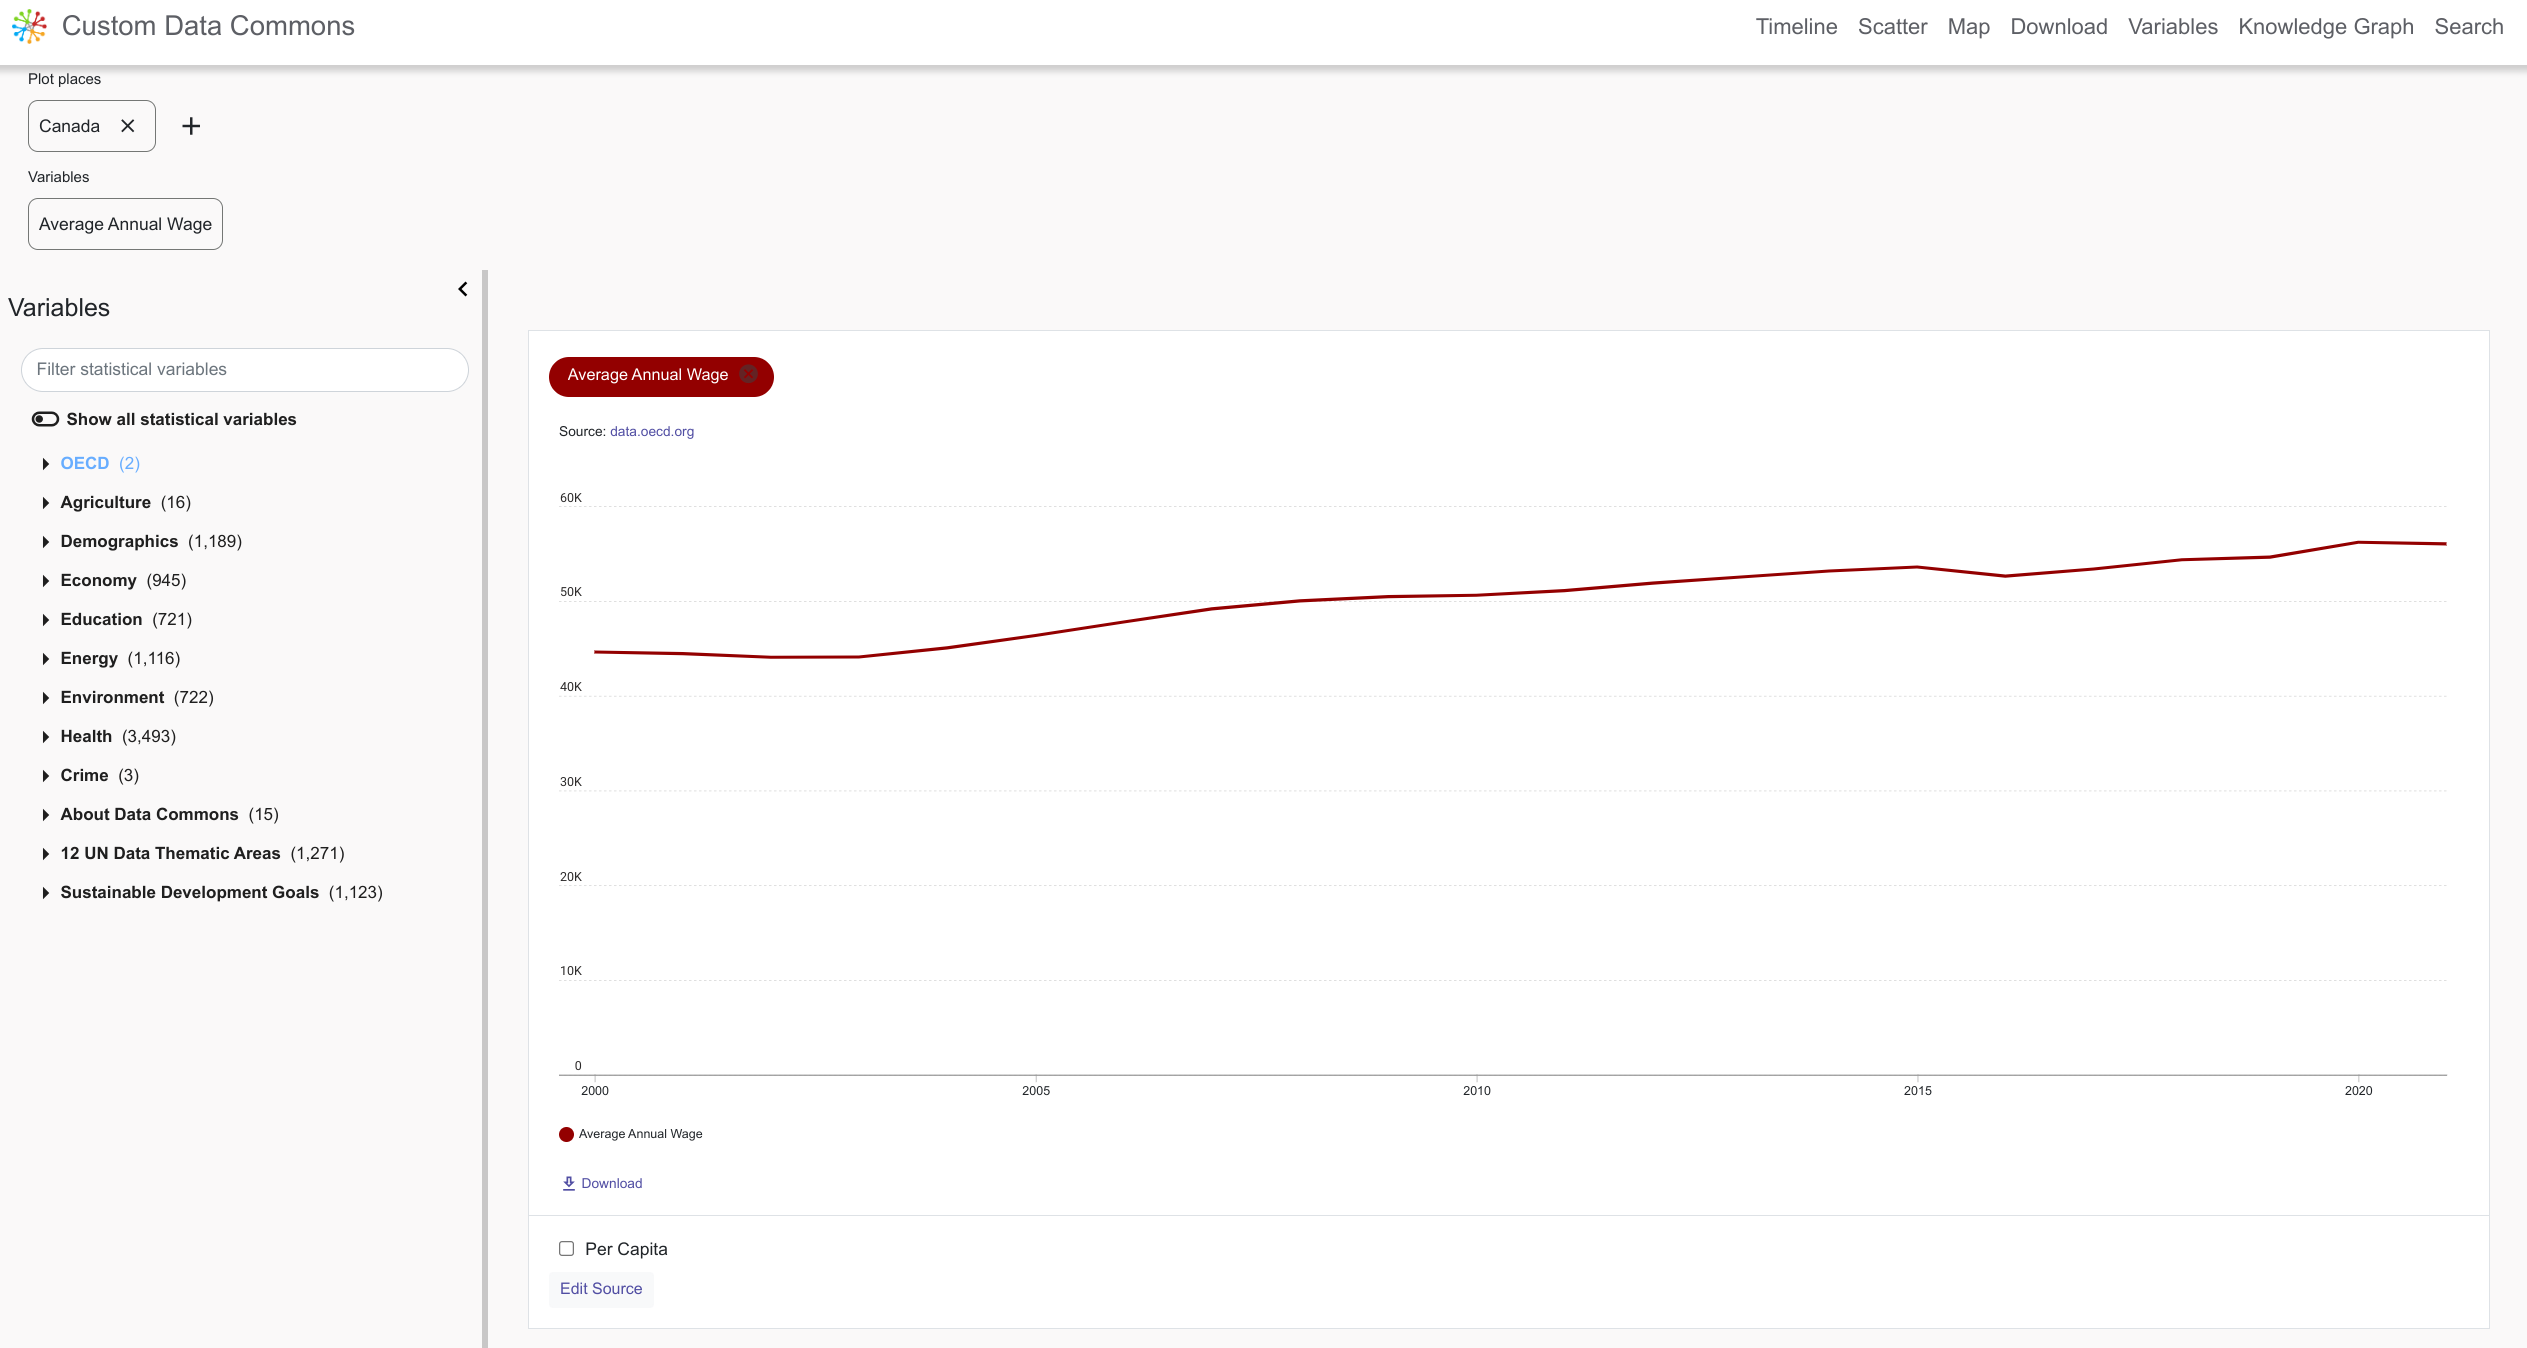
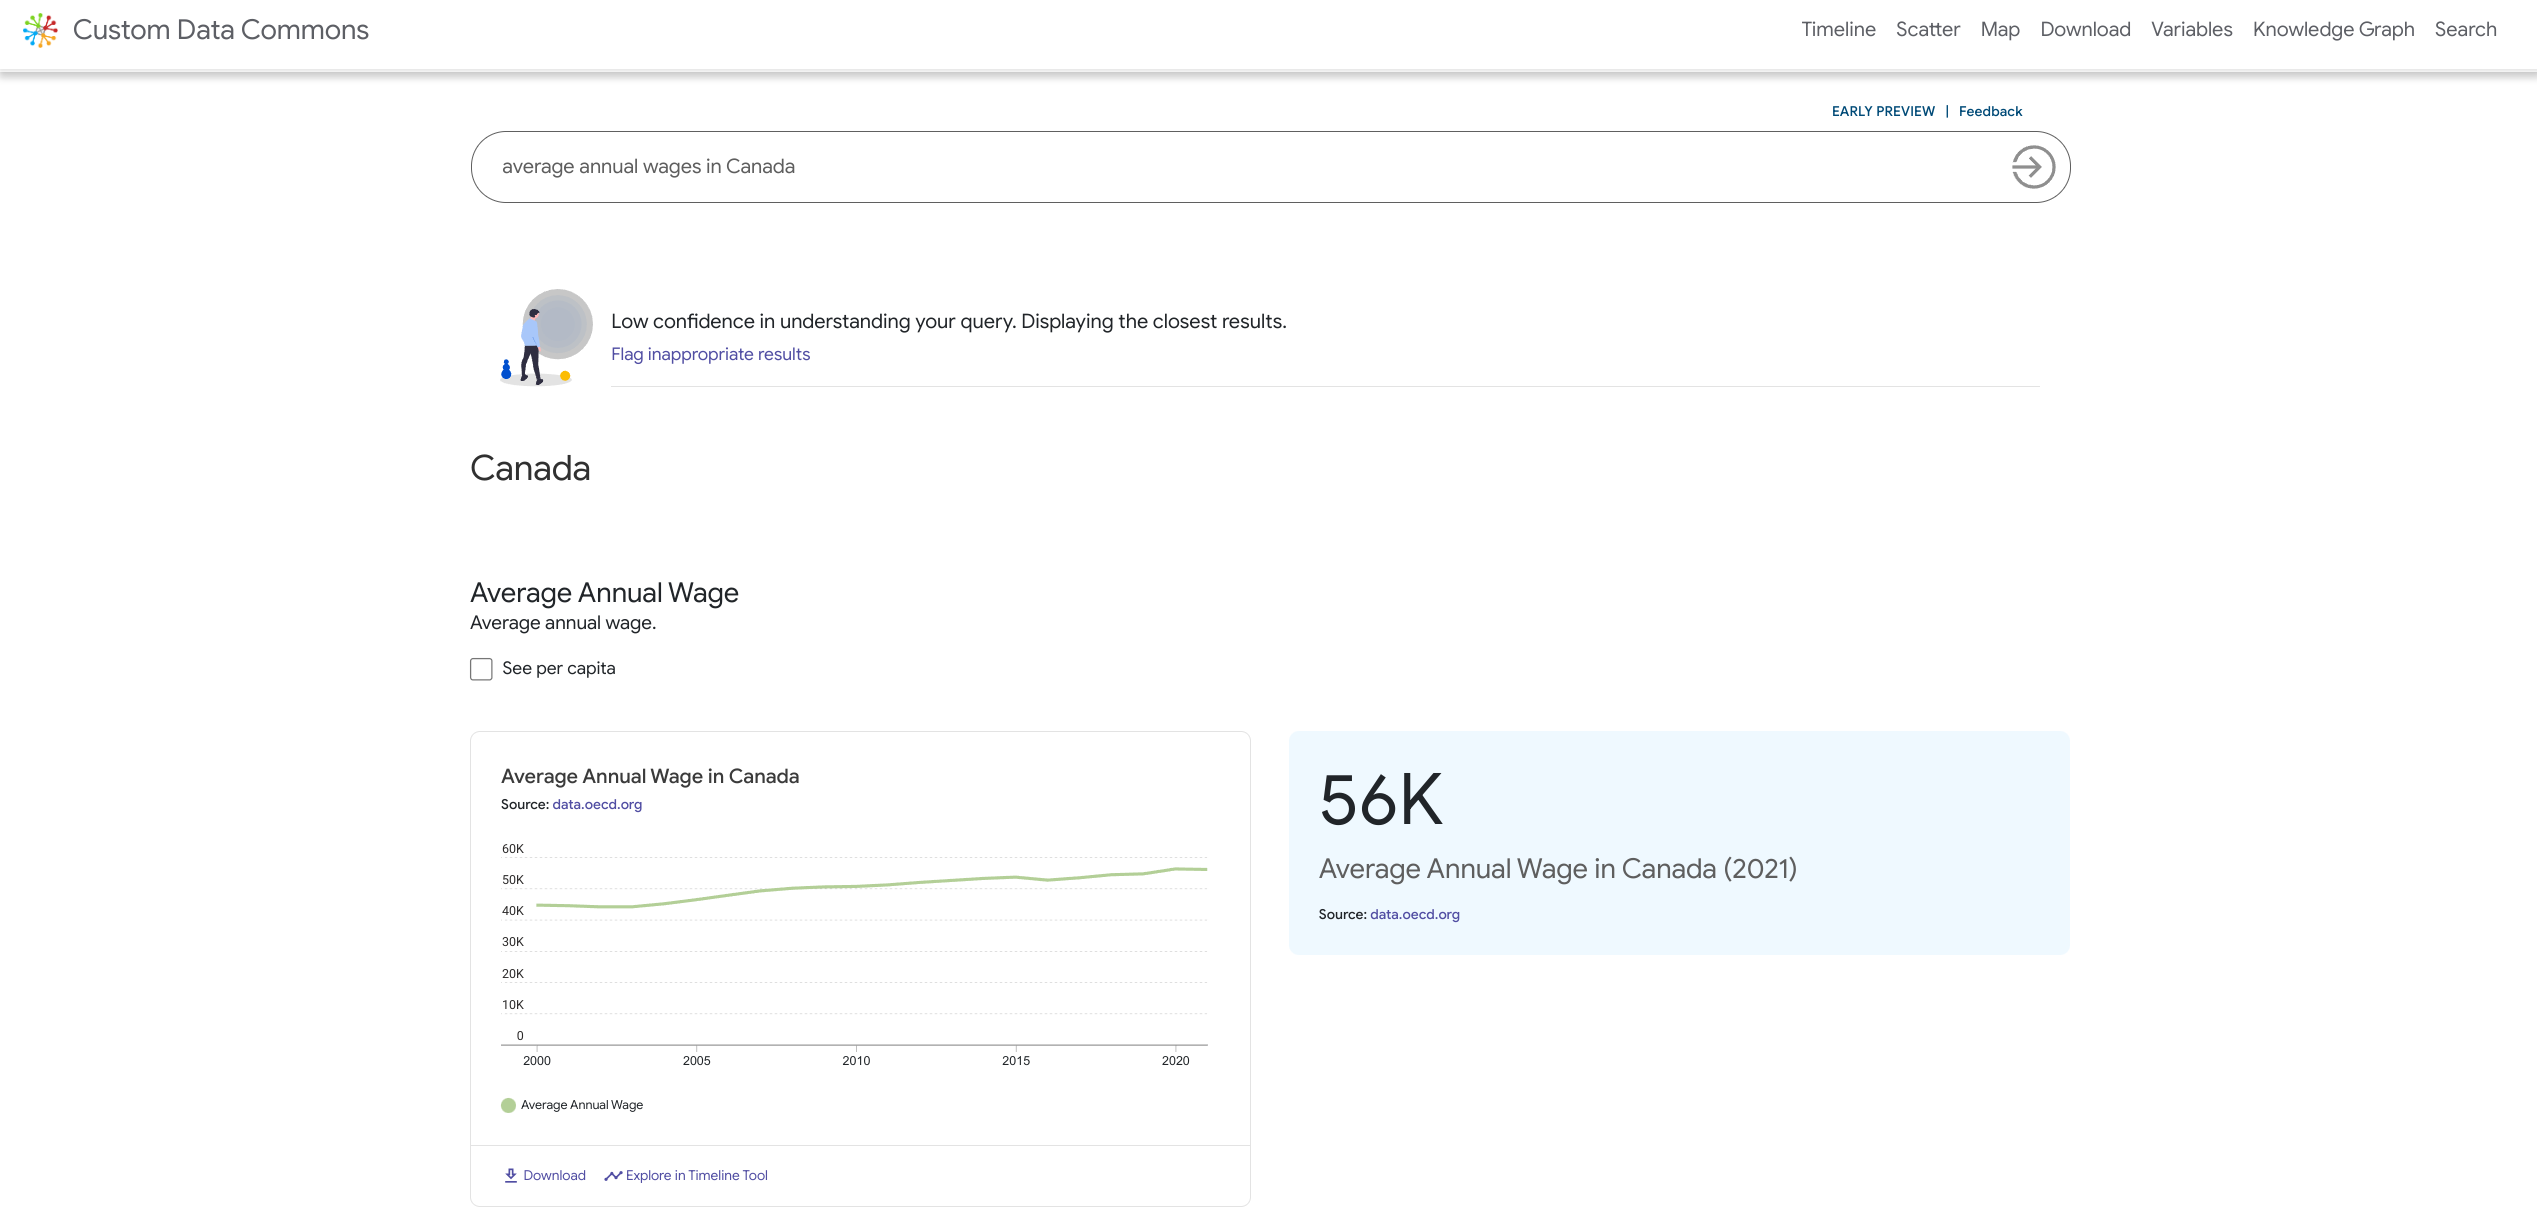
Now, select Tools > Timeline Explorer to open the Timeline Explorer. In the Select places field, enter an OECD country, for example, Canada, and select one or both variables from the left pane. The timeline chart automatically loads in the right pane.
Now try issuing some natural-language queries. Click the Data Commons link to go back to the home page. In the search bar, type in queries against the sample data. For example, enter “What are the average annual wages in Canada Try NL queries against the sample data you just loaded, e.g. “Average annual wages in Canada”.
Send an API request
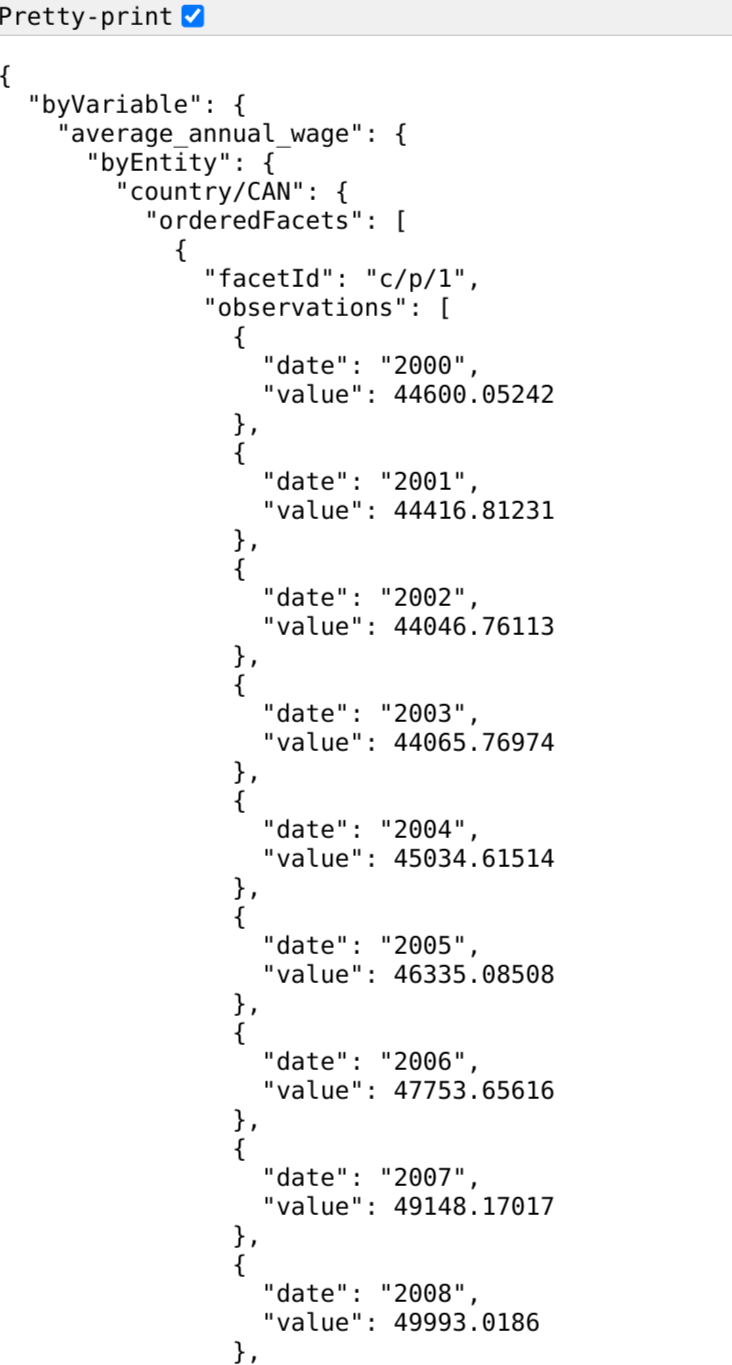
A custom instance can accept REST API requests at the endpoint /core/api/v2/, which can access both the custom and base data. To try it out, here’s an example request you can make to your local instance that returns the same data as the interactive queries above, using the observation API. Try entering this query in your browser address bar:
http://localhost:8080/core/api/v2/observation?entity.dcids=country%2FCAN&select=entity&select=variable&select=value&select=date&variable.dcids=average_annual_wage
Note: You do not need to specify an API key as a query parameter.
If you select Prettyprint, you should see output like this:
Docker commands
The Bash script used on this page runs the following commands:
docker run \
  --env-file $PWD/custom_dc/env.list \
  -v $PWD/custom_dc/sample:$PWD/custom_dc/sample \
  -v $PWD/custom_dc/sample:$PWD/custom_dc/sample \
  gcr.io/datcom-ci/datacommons-data:stable

docker run -i \
  -p 8080:8080 \
  -e DEBUG=true \
  --env-file $PWD/custom_dc/env.list \
  -v $PWD/custom_dc/sample:$PWD/custom_dc/sample \
  -v $PWD/custom_dc/sample:$PWD/custom_dc/sample \
  gcr.io/datcom-ci/datacommons-services:stable
Troubleshooting
Having trouble? Visit our Troubleshooting Guide for detailed solutions to common problems.
Page last updated: July 06, 2026 • Send feedback about this page