Launch your Data Commons
- TOC
Overview
When you are ready to launch your site to external traffic, there are many tasks you will need to perform, including:
- Configure your Cloud Run Service to serve external traffic, over SSL. Follow the procedures in Serve traffic from your service.
- Optionally, configure Google Cloud Armor to detect and block unwanted traffic. This is recommended for large services. Follow the procedures in Detect and prevent bot traffic.
- Optionally, restrict access to your service; see Restrict public access to your service.
- Optionally, increase the number of Docker service container instances. See Increase the services container replication for procedures.
- Optionally, add a caching layer to improve performance. This is recommended for all production Data Commons instances. We have provided specific procedures to set up a Redis Memorystore in Improve database performance.
- Optionally, boost Cloud SQL instance resources if needed. See Boost SQL resources
- Optionally, add Google Analytics to track your website’s usage. Procedures for configuring Google Analytics support are in Add Google Analytics tracking.
Throughout these procedures, we recommend using Terraform to create a production deployment.
Note: If you make future updates to this deployment, we recommend always using Terraform to do so. If you use the Cloud Console or gcloud to make updates and try to run Terraform again, it will override any changes you have made outside of Terraform. For options that are available as variables in the Data Commons
variables.tf, you must sync your productionterraform.tfvarsoptions to the same values you have set outside Terraform before running Terraform commands again. If you use the Cloud Console or gcloud to configure options that are not available as Data Commons variables, you must not run Terraform again.
Serve traffic from your service
For Cloud Run services, you use a global external load balancer, even if you’re only running in a single region. Follow the procedures in Set up a global external Application Load Balancer as follows:
- Reserve an external IP address.
- Create SSL certificates.
- Add the load balancer.
- Add or modify DNS records to map your domain name to the new IP address.
Detect and prevent bot traffic with Google Cloud Armor
Once your website reaches wide adoption, it will likely be hit by unwanted bot traffic. This can cause major spikes in your resource usage. If your project is sensitive to sudden increases in resource charges, you should set up Google Cloud Armor, with Adaptive Protection, before such attacks happen.
Tip: If you are unsure about whether you will need Cloud Armor, you can use Google Analytics to easily monitor and notify you of traffic anomalies. (This is a free service.) To configure these notifications, you create “custom insights”. There are several predefined, “recommended” insights related to traffic spikes, which you only need to enable. See the Analytics Insights page for procedures.
With Cloud Armor, you can choose from two tiers:
- Enterprise: This is a paid subscription (see Cloud Armor Pricing for details) that includes all charges for resource usage. We highly recommend the “Paygo” option, as the Adaptive Protection feature provides out-of-the-box, automatic anomaly detection and prevention with minimal setup.
- Standard: This service has no subscription fee, but does charge for resource usage. However, the Adaptive Protection service will only detect and alert you about anomalies without further action or information. You are responsible for defining and applying policy rules to block undesired traffic.
Both options allow you to block by IP address range or other “advanced” attributes, and provide a set of actions you can choose for dealing with unwanted traffic: deny, rate-limit, redirect and display a captcha, etc.
For more details comparing the two options, see the Cloud Armor Enterprise Overview. If you decide to subscribe to Enterprise, see Use Cloud Armor Enterprise for instructions on enrolling.
Recommended workflows
If you subscribe to the Enterprise tier, use the following workflow:
- Create a security policy and enable Adaptive Protection.
- Allow several hours for Adaptive Protection to get trained to recognize anomalies according to your traffic patterns. If an attack is detected, a detailed alert will appear on the Adaptive Protection dashboard, including the source of the traffic, and suggested rules for handling.
- Update your policy to enable Auto Deploy and create a rule that defines the action to be taken automatically when an attack is detected.
- Optionally, create additional manual IP-based rules.
If you only use the Standard tier, use the following workflow:
- Create a security policy and enable Adaptive Protection.
- Allow several hours for Adaptive Protection to get trained to recognize anomalies according to your traffic patterns. If an attack is detected, a basic alert will appear on the Adaptive Protection dashboard.
- Use Google Analytics Insights to get some high-level information on the origin of the spiky traffic, such as country, surface, etc. Then use the Cloud Run Logs Analytics facility to analyze the logs for the time in which the attack occurred. Continue to analyze the logs until you identify the IP addresses from which the unwanted traffic originated.
- Create manual IP-based rules.
Create a Cloud Armor security policy
Regardless of which Cloud Armor tier you choose, you must set up a Cloud Armor security policy. To start, you set up a basic policy that simply allows all traffic.
Tip: There is an unofficial wizard tool that guides you through the process of configuring a security policy: https://cabuilder.cloudnetdemo.com/. It also generates Terraform output that you can add to your Terraform scripts. However, it may not be completely up to date with features available in the Cloud Console or gcloud CLI, and cannot be used to update an existing policy. So use with caution.
- Cloud Console
- gcloud CLI
- Go to the https://console.cloud.google.com/net-security/securitypolicies/list page for your project.
- Click Create policy.
- Under Configure policy, add a name for the policy and optionally a description.
- Change the Default rule action to Allow.
- Keep all the other default settings.
- Click Apply to targets.
- From the Backend service drop-down, select the backend service you created when you created the load balancer.
- Under Advanced configurations, select Enable Adaptive Protection.
- Click Done.
- Click Create policy. It may take a few minutes to complete. When it is created, your new policy will be listed in the Cloud Armor policies page.
- Create the policy and enable Adaptive Protection:
gcloud compute security-policies create POLICY_NAME \ --type CLOUD_ARMOR --description "DESCRIPTION" \ --enable-layer7-ddos-defense - Apply the policy to the backend you created when you created the load balancer:
gcloud compute backend-services update BACKEND_NAME \ --security-policy POLICY_NAME - Set the default rule to allow all traffic:
gcloud compute security-policies rules create 2,147,483,647 \
         --security-policy POLICY_NAME --description "Default rule" \
         --expression "*" --action allow
Add blocking rules to your policy
If you are subscribed to the Enterprise tier, you can simply add a default action for how you want “attacks” detected by Adaptive Protection to be handled. You don’t need to define any conditions that trigger the handling; you can simply enable the Auto Deploy feature, and Cloud Armor will take care of the rest. You can also create additional rules as needed.
If you are not subscribed to Enterprise, you will need to use your Cloud Run’s Service Logs Analytics to find the source of the unwanted traffic, and then configure a rule in your Cloud Armor security policy. We recommend that you use the simplest approach, which is to determine the IP addresses or ranges that are sending the traffic and define a rule to block traffic from these addresses.
For handling bot traffic, we recommend that you use a “rate-based ban” as the action to be taken when a rule is triggered. There are two important rule-triggering criteria, which can be somewhat confusing, so we explain them here:
- The threshold setting: This defines a threshold beyond which requests from a given client that exceed the threshold are blocked. For example, let’s say you define the threshold to be 1000 requests over a 1-minute period. If a client sends 2500 requests, that client will be limited to 1000 for the configured ban duration. You can use this setting to maintain your traffic at a predefined level.
- The ban threshold setting: This defines a threshold beyond which all requests from a given client are blocked. For example, let’s say you define the threshold to be 2500 requests over a 2-minute period. If a client sends 3000 requests during that period, all requests from that client will be blocked for the configured ban duration. You can use this setting to minimize your resource usage.
You can use either or both settings. The values you set should be based on your expected traffic levels and resource capacity. See Banning clients based on request rates for more information.
Enable Auto-Deploy for Adaptive Protection (Enterprise only)
The following defines a rule for handling traffic when Adaptive Protection detects an attack, and configures the rule to be applied automatically to mitigate the attack.
- Cloud Console
- gcloud CLI
- Go to the https://console.cloud.google.com/net-security/securitypolicies/list page for your project.
- In the Policy details page, click Edit.
- Expand the Adaptive Protection configuration section.
- Click Add a threshold configuration.
- For now, keep all the default settings and give the configuration a name.
- Click Update. It will take a few minutes to update.
- In the Policy details page, click Add rule.
- Add a description of the rule.
- Enable Advanced mode.
- In the Match field, enter
evaluateAdaptiveProtectionAutoDeploy(). This means that Adaptive Protection will define the sources to be blocked, based on IP addresses, HTTP headers, or other attributes of the traffic. - From the Action drop-down, select Rate based ban.
- In the Threshold setting section, specify the request rate and time interval at which the rule is triggered. Any client that sends more requests in the time period will be limited to the threshold you set for the duration of the ban interval.
- Set Enforce on key configuration to IP.
- Keep the default action of Deny (429).
- Optionally, under Exceed configuration, specify the request rate and time interval at which offending IP addresses should be blocked. Any client that sends more requests in the time period will be prevented from sending any requests for the duration of the ban interval.
- In the Priority field, enter a value lower than 2,147,483,647.
- Click Create policy. It may take a few minutes to complete. When it is created, your new policy will be listed in the Cloud Armor policies page.
- Enable Auto-Deploy and add a default threshold configuation:
gcloud compute security-policies add-layer7-ddos-defense-threshold-config POLICY_NAME \ --threshold-config-name=CONFIGURATION_NAME - Add a rule for the action Adaptive Protection should take when it determines that an "attack" has occurred:
gcloud compute security-policies rules create PRIORITY \ --security-policy POLICY_NAME \ --expression "evaluateAdaptiveProtectionAutoDeploy()" \ --action rate-based-ban \ --rate-limit-threshold-count=RATE_LIMIT_THRESHOLD_COUNT \ --rate-limit-threshold-interval-sec=RATE_LIMIT_THRESHOLD_INTERVAL_SEC \ --ban-duration-sec=BAN_DURATION_SEC \ --ban-threshold-count=BAN_THRESHOLD_COUNT \ --ban-threshold-interval-sec=BAN_THRESHOLD_INTERVAL_SEC \ --exceed-action deny-429 \ --enforce-on-key ip - Set the priority to a value lower than 2,147,483,647.
- Set the rate limit threshold count and interval to define the condition which triggers the rule. Any client that sends more requests in the time period will be limited to the threshold you set for the ban duration.
- Set the ban threshold count and interval to define the condition that bans traffic from offending clients. Any client that sends more requests in the time period will be prevented from sending any requests for the ban duration.
- Set the ban duration to the desired length of the ban.
Create a simple IP address-based rate-limiting rule
Before creating a rate-limiting rule, you will need to do some monitoring to determine the clients that are sending unwanted traffic. When you receive an alert, note the date and time at which the attack was detected, or check the Adaptive Protection dashboard. Then, use Cloud Log Analytics to help diagnose the source of the traffic. We recommend that you try to find the IP addresses that are sending the traffic, and block by IP. Once you have determined a set or range of IP addresses, set up a rule as follows.
- Cloud Console
- gcloud CLI
- Go to the https://console.cloud.google.com/net-security/securitypolicies/list page for your project.
- Click the link for the policy you created above.
- In the Policy details page, click Add rule.
- Add a description of the rule.
- In the Match field, enter the range or list of IP addresses.
- From the Action drop-down, select Rate based ban.
- In the Threshold setting section, specify the request rate and time interval at which the rule is triggered. Any client that sends more requests in the time period will be limited to the threshold you set for the duration of the ban interval.
- Set Enforce on key configuration to IP.
- Keep the default action of Deny (429).
- Optionally, under Exceed configuration, specify the request rate and time interval at which offending IP addresses should be blocked. Any client that sends more requests in the time period will be prevented from sending any requests for the duration of the ban interval.
- In the Priority field, enter a value lower than 2,147,483,647.
- Click Create policy. It may take a few minutes to complete. When it is created, your new policy will be listed in the Cloud Armor policies page.
gcloud compute security-policies rules create PRIORITY \
      --security-policy POLICY_NAME \
      --action rate-based-ban \
      --rate-limit-threshold-count=RATE_LIMIT_THRESHOLD_COUNT \
      --rate-limit-threshold-interval-sec=RATE_LIMIT_THRESHOLD_INTERVAL_SEC \
      --ban-duration-sec=BAN_DURATION_SEC \
      --ban-threshold-count=BAN_THRESHOLD_COUNT \
      --ban-threshold-interval-sec=BAN_THRESHOLD_INTERVAL_SEC \
      --exceed-action deny-429 \
      --enforce-on-key ip
- Set the priority to a value lower than 2,147,483,647.
- Set the rate limit threshold count and interval to define the condition which triggers the rule. Any client that sends more requests in the time period will be limited to the threshold you set for the ban duration.
- Set the ban threshold count and interval to define the condition that bans traffic from offending clients. Any client that sends more requests in the time period will be prevented from sending any requests for the ban duration.
- Set the ban duration to the desired length of the ban.
Restrict public access to your service
By default when you create a new Cloud Run service, it is set up with global public access. If you wish to restrict access to only authenticated and authorized users, you can do so by making the service private and requring access tokens from your users. To set your instance to private:
- Create a production Terraform configuration file and Terraform workspace, if you haven’t already done so.
- Edit the file to add the following line:
make_dc_web_service_public = false - Switch to the production workspace and run the Terraform deployment as usual.
Follow additional procedures in Authenticate users to complete your setup.
Increase replication of the services container
Google Cloud Run services use auto-scaling, which means that the number of instances of your services container is increased or decreased according to the traffic the service is receiving. By default, the Terraform scripts set the minimum and maximum number of instances to 1. For production traffic, we suggest increasing the maximum to at least 3. (We recommend keeping the default minimum instances setting of 1, to avoid delays when new revisions are deployed.)
- Create a production Terraform configuration file and Terraform workspace, if you haven’t already done so.
- Edit the file to add the following line:
dc_web_service_max_instance_count = 3 - Switch to the production workspace and run the Terraform deployment as usual.
Improve database performance
Use a caching layer
We recommend that you use a caching layer to improve the performance of your database. We recommend Google Cloud Redis Memorystore, a fully managed solution, which will boost the performance of both natural-language searches and regular database lookups in your site. Redis Memorystore runs as a standalone instance in a Google-managed virtual private cloud (VPC), and connects to your VPC network (“default” or otherwise) via direct peering. Your Cloud Run service and job connect to the instance using a Direct VPC egress.
The Terraform scripts set up a single Redis instance called NAMESPACE-datacommons-redis-instance.
To configure caching using Terraform:
- Create a production Terraform configuration file and Terraform workspace, if you haven’t already done so.
- Edit the file to add the following:
enable_redis = true - Switch to the production workspace and run the Terraform deployment as usual.
It will take several minutes to create the Redis instance. To verify that queries are hitting the cache, see below.
Verify caching
To verify that traffic is hitting the cache:
- Run some queries against your running Cloud Run service.
- Go to https://console.cloud.google.com/memorystore/redis/instances for your project.
- Select the Redis instance that has just been created.
- Under Instance Functions, click Monitoring.
- Scroll to the Cache Hit Ratio graph. You should see a significant percentage of your traffic hitting the cache.
Clearing the cache after data load
When the REDIS_HOST (and optionally REDIS_PORT) variables are configured for the data management job, the Redis instance is flushed any time data is reloaded. The Terraform scripts configure this for you, so there is no need to manually clear the cache after reloading data.
Boost Redis resources
By default, the Terraform scripts configure the Redis instance with the following characteristics:
- 2 GiB memory reservation
- “Standard high-availability” tier, without read replicas
If you encounter performance problems after launch, there are a few Redis parameters you can adjust. In particular, if needed, we suggest increasing the memory allocation.
- Go to https://console.cloud.google.com/memorystore/redis/instances for your project and select your Redis instance.
- Go to Overview > Monitoring and from the Chart menu, select Memory usage/Max memory graph.
- If you notice that memory usage is approaching the max memory, add the following variable in your production
.tfvarsfile, with this recommended value:
redis_memory_size_gb = 4
- Run the Terraform deployment as usual.
You may also want to enable read-only replication; you can set redis_replica_count = 3 if needed.
Boost SQL resources
By default, the Terraform scripts configure the MySQL instance with the following characteristics:
- 2 CPUs
- 20 GB SSD storage
- 7680 MB memory
If you are still noticing slow performance after adding a caching layer, you may need to increase resource reservations. In particular, if your storage is filling up, you will need to add more storage quota.
- Go to https://console.cloud.google.com/sql/instances for your project and select your MySQL instance.
- Go to Overview > Monitoring and from the Chart menu, and select Storage Usage.
- If you notice that storage using is approaching quota, set the following variable in your production
.tfvarsfile:
mysql_storage_size_gb
- Set a value that fits your database size.
- Run the Terraform deployment as usual.
You may also use the following variables to increase memory and CPU reservations if needed. You must set them together to align with the Cloud SQL Enterprise edition machine type constraints; for details, see the section Machine types for Cloud SQL Enterprise edition instances in https://cloud.google.com/sql/docs/mysql/instance-settings.
mysql_memory_size_mb
mysql_cpu_count
For example, this is legal because it aligns with the “db-n1-standard-4” machine type:
mysql_cpu_count = 4
mysql_memory_size_mb = 15360
But this is not legal because it does not align with any machine type:
mysql_cpu_count = 2
mysql_memory_size_mb = 15360
Add Google Analytics reporting
Google Analytics provides detailed reports on user engagement with your site. In addition, Data Commons provides a number of custom parameters you can use to report on specific attributes of a Data Commons site such as, search queries, specific page views, etc.
Enable Analytics tracking
If you don’t already have a Google Analytics account, create one, following the procedures in Set up Analytics for a website and/or app. Record the Analytics tag ID assigned to your account.
Enable tracking:
- Create a production Terraform configuration file and Terraform workspace, if you haven’t already done so.
- Edit the file to add the following line:
google_analytics_tag_id = "ANALYTICS_TAG_ID"
- Switch to the production workspace and run the Terraform deployment as usual.
Data collection will take a day or two to start and begin showing up in your reports.
Report on custom dimensions
Data Commons exports many Google Analytics custom events and parameters, to allow Data Commons-specific features to be logged, such as search queries, specific page views, etc. You can use these to create custom reports and explorations. The full set is defined in website/static/js/shared/ga_events.ts. Before you can get reports on them, you need to create custom dimensions from them.
To create a custom dimension for a Data Commons custom event:
- In the Google Analytics dashboard for your account, go to the Admin page.
- Select Data display > Custom definitions.
- Click Create custom dimension.
-
Keep the Scope as Event and click the Event parameter > Select event parameter drop-down to see the list of custom event parameters.
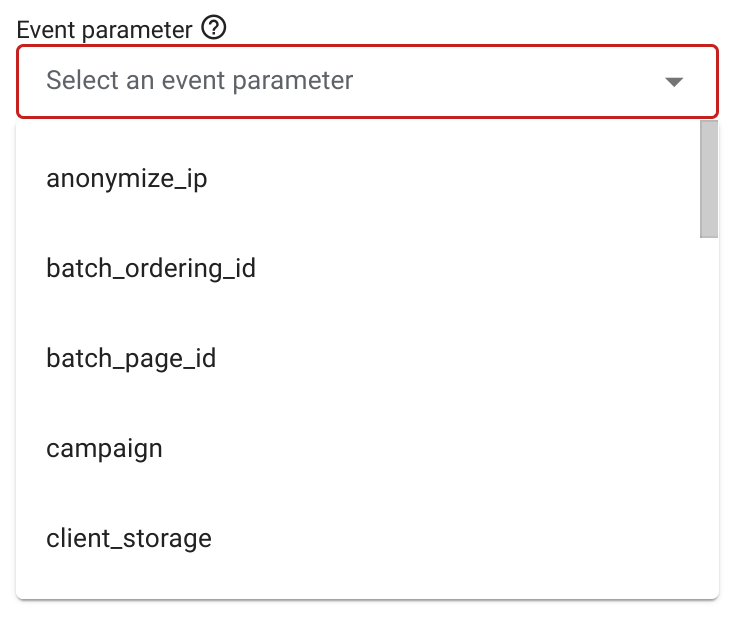
- Select the parameter you need, for example, query.
- Add a dimension name and description. These can be anything you want but the name should be meaningful as it will show up in reports; for example,
Search query. - When done, click Save.
- Select Data display > Events and you should see a number of new custom events that have been added to your account.
To create a report based on a custom event:
- In the Google Analytics dashboard for your account, go to the Explore page and select Blank - create a new exploration.
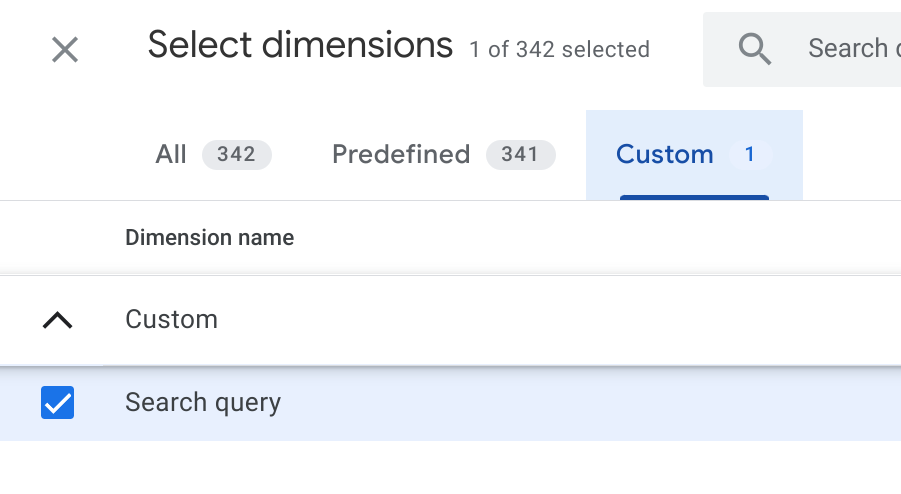
- Select Variables > Dimensions > + to open the Select dimensions window.
-
Select the Custom, select the dimension you want, for example, Search query, and click Import.
- Select Variables > Metrics > + to open the Select metrics window.
- Select the relevant metric you want, such as users, sessions, or views, etc. and click Import.
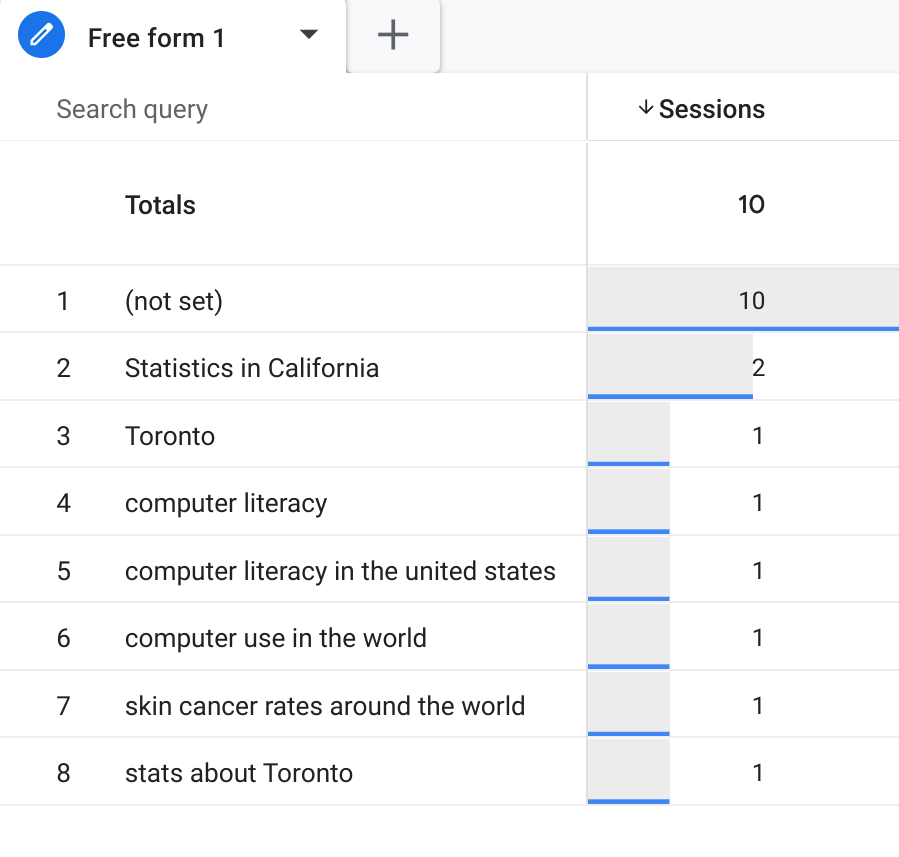
- Select Settings > Rows > Drop or select dimension and from the drop-down menu, select the dimension you want, such as Search query.
- Select Settings > Values > Drop or select metric and from the drop-down menu, select the metric of interest, such as users, sessions, views, etc.
- Edit any other settings you like and name the report. For the first 48 hours you will see (not set) for the first row. Afterwards, rows will be populated with real values.
Page last updated: July 06, 2026 • Send feedback about this page