Analyze the CDC 500 cities for sleep health
Introduction
The Data Commons API enables easy access to health data for the 500 cities the U.S. Centers for Disease Control and Prevention (CDC) has prioritized for public health information tracking. This tutorial will walk you through accessing and analyzing that information and scoring each of the cities according to adults residents’ excellence in sleep habits, for the year 2020.
Step 1: Setup
Pull up Google Sheets and create a new, blank spreadsheet. You can title it Data Commons CDC 500 sleep analysis or any other name of your choosing.
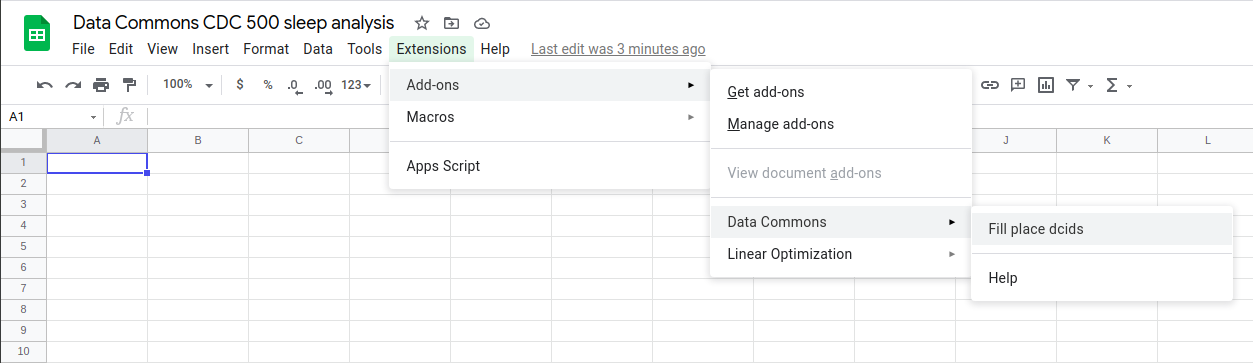
To enable the Data Commons API in your spreadsheet, ensure that the Data Commons extension is installed and available under the Extensions menu. Hover over the Data Commons menu item, then click on the Fill place DCIDs option.
Step 2: Get the DCIDs and names of cohort members
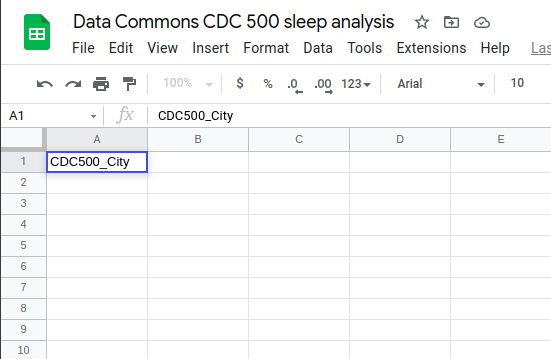
Data Commons provides the method DCCOHORTMEMBERS for obtaining the members of a Data Commons cohort. Here, you’ll use this method to retrieve the cities in the CDC 500 cohort. Start by double-clicking on A1 in the chart and enter CDC500_City.
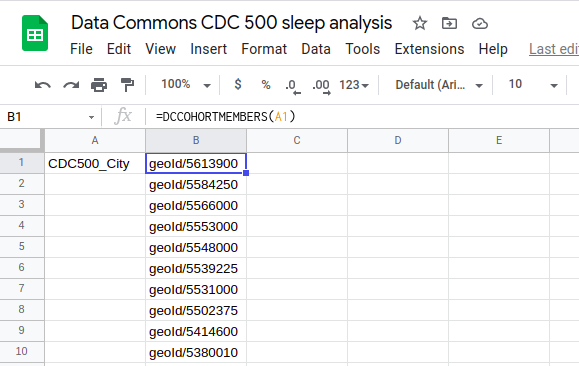
In cell B1, enter =DCCOHORTMEMBERS(A1). The output should look like this:
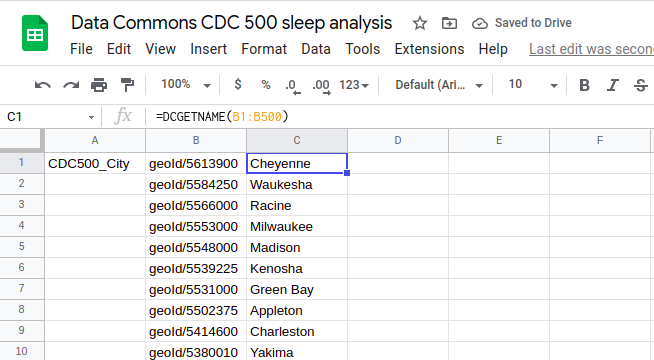
To get the names of these cities, enter =DCGETNAME(B1:B) into cell C1. The output should look like this:
Step 3: Obtain the sleep health level for each city
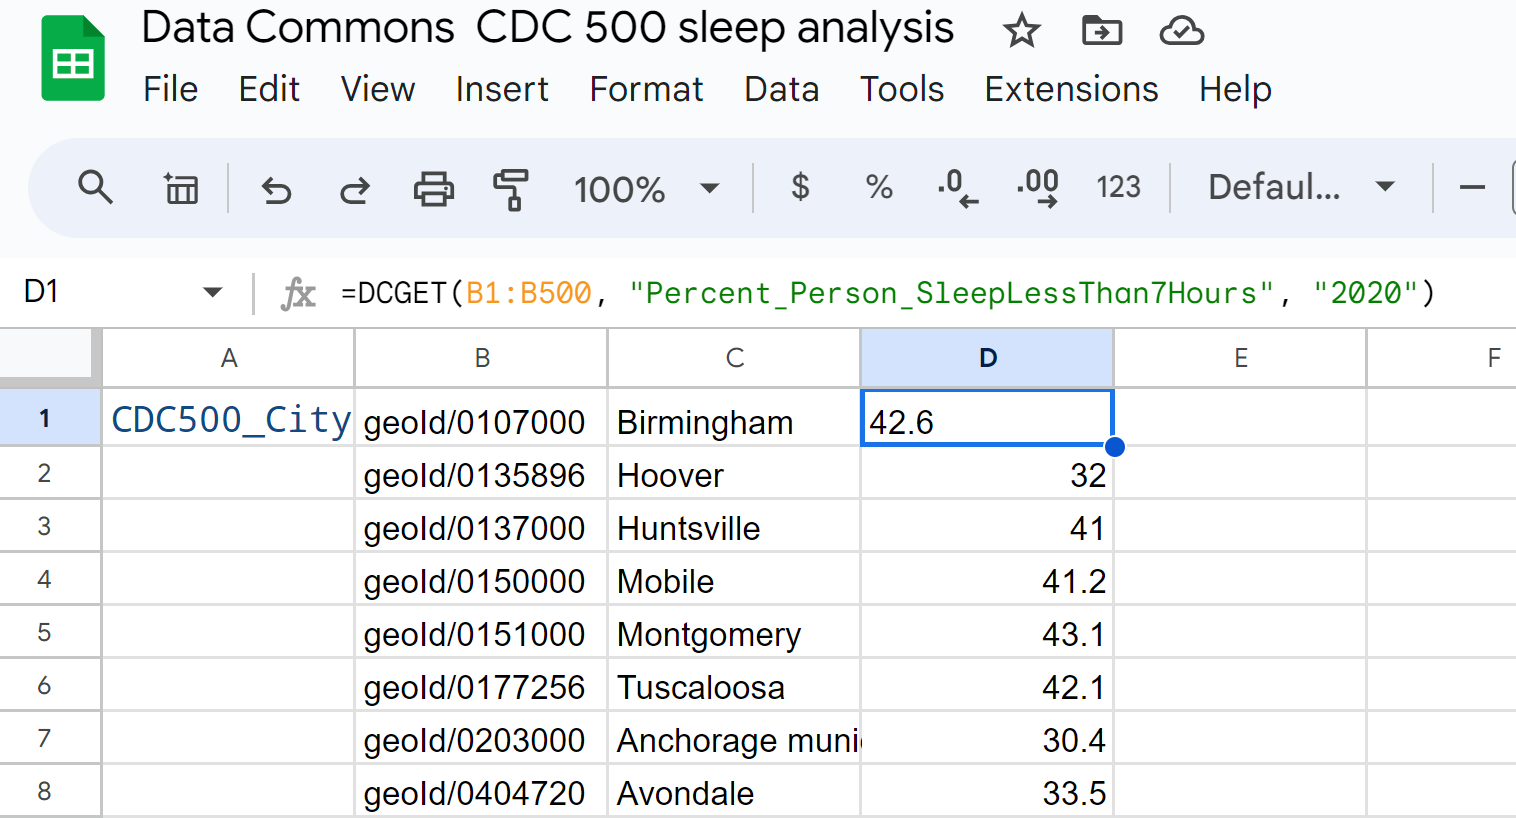
We will use the percentage of chronically restless residents in each city using the DCGET method with the statistical variable Percent_Person_SleepLessThan7Hours. (More information on statistical variables is available in the glossary.) Enter =DCGET(B1:B, "Percent_Person_SleepLessThan7Hours", "2020") into cell D1 in your spreadsheet. The output should look like this:
Step 4: Sort on sleep score
- Select columns B, C, and D, and choose Edit > Copy.
- Select Insert > Sheet to add a new sheet.
- Select Edit > Paste special > Values only.
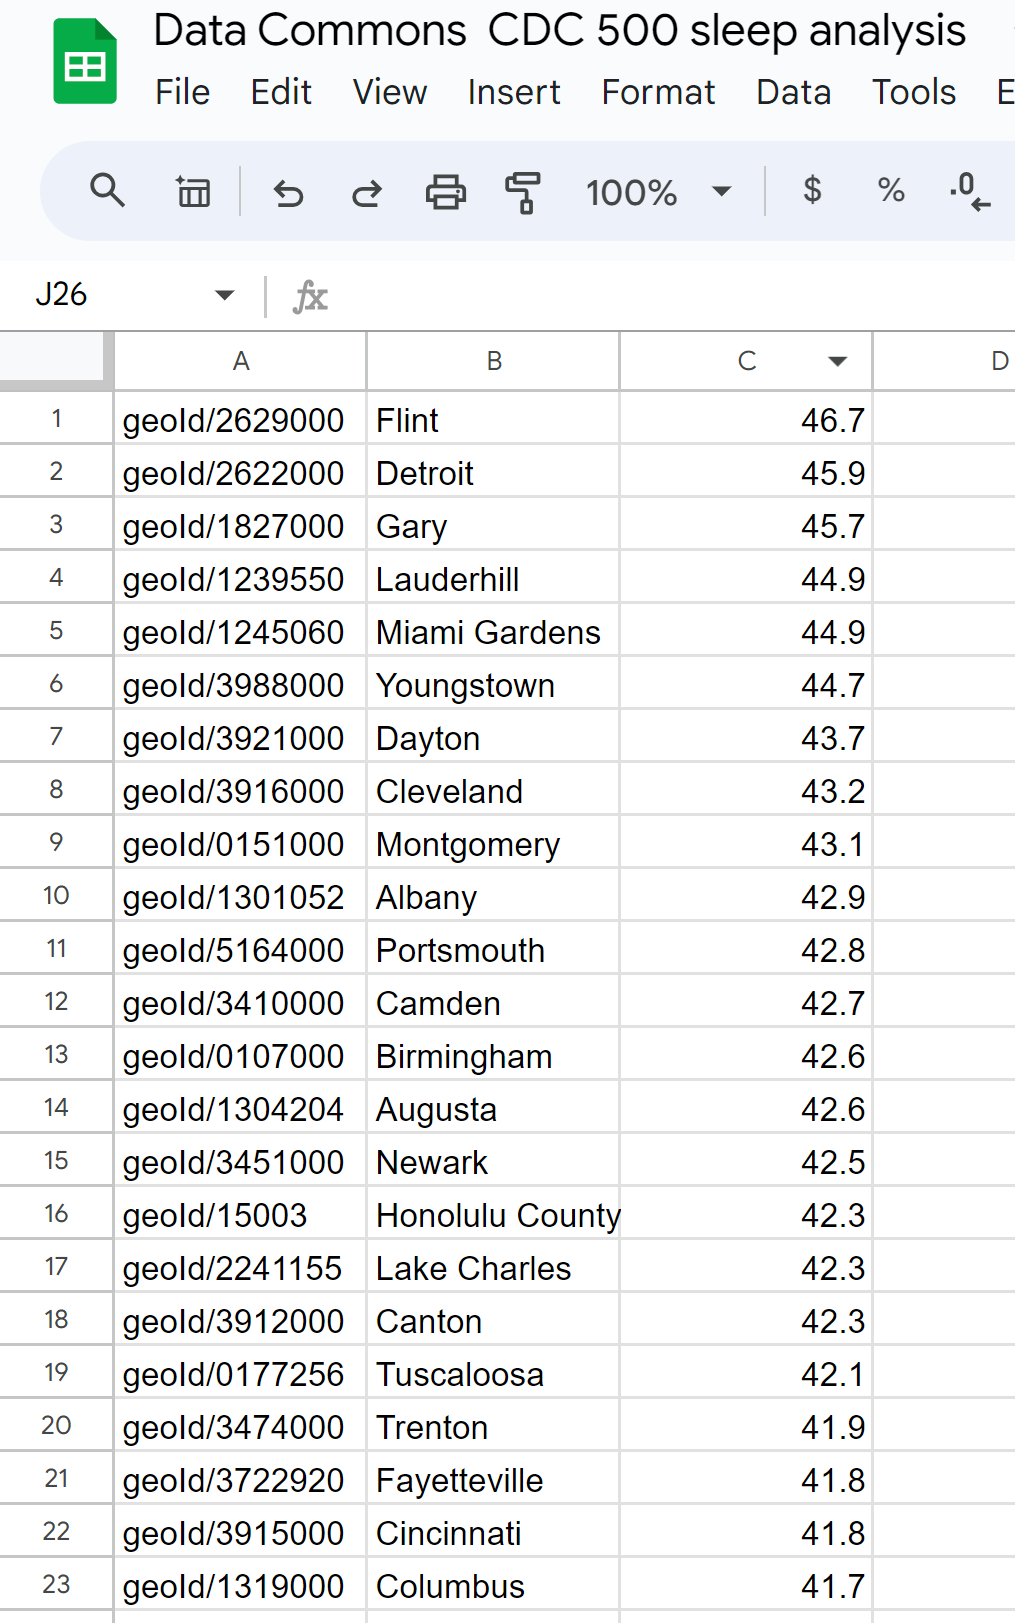
- Select column C, click the down arrow, and select Sort sheet Z to A.
Your final output should look like this:
Page last updated: March 27, 2025 • Send feedback about this page